Appendix A. Employee Survey Results
Summary
This appendix provides results from the Multnomah County Library employee survey. We conducted this survey to learn about Library employees' perceptions about workplace equity, staffing, and workplace safety and security. The anonymous survey was distributed to library employees in November 2022. We received 421 survey responses, about 76% of the Library's active employees at the time the survey was distributed.
We organized the survey into three sections: Workforce Equity and Staffing, Safety and Security, and Demographic Questions. The demographic questions included race and ethnicity, library work area, job classification, language and cultural skills and abilities designation (KSA), and types of interactions with the public. The survey also included optional short response questions.
Survey Results are Representative of Library Workforce
Employee survey demographic results are overall representative of the Library workforce. We compared the Library workforce demographic data to the demographic data reported on the employee survey. For our analysis, we included represented, non-represented, limited duration, and on-call employees that were actively working at the Library at the time the survey was distributed. We found that there was less than a 5% difference in representation of BIPOC employees, job classifications, and employees with a cultural/language KSA designation. There are possible areas where some demographic groups are underrepresented. White employees make up 62% of the Library's workforce and 55% of survey responses, a 7% difference. They may have also selected "Decline to Answer" for the race and ethnicity question, which made up 12% of the responses.
When looking at Library Work Areas, the work teams within the Library, there was some variation depending on how the Library workforce demographic data reports are downloaded. In addition, there were also some shifts in work teams during the Library's staffing reorganization initiative. We found that Location Services (67% of Library workforce and 57% of survey responses) and Administration and Management (15% of Library workforce and 4% of survey responses) may be slightly underrepresented. Alternatively, some employees may have also selected "Decline to Answer", which made up 14% of survey responses to this question.
Workplace Equity and Staffing
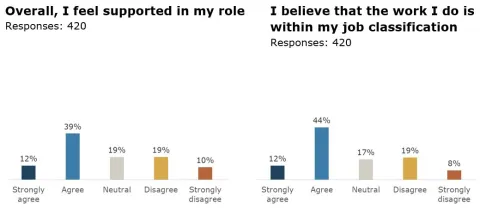
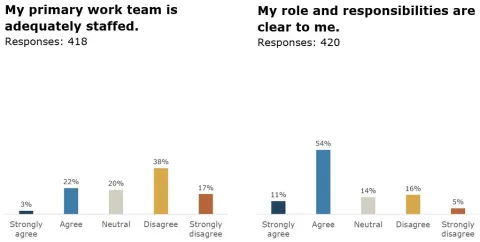
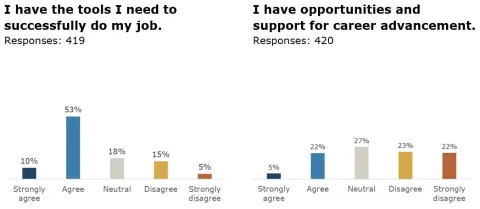
Overall, 51% of Library employees reported feeling supported in their role. Most Library employees responded that they believe the work they do is within their classification (56%), roles and responsibilities are clear to them (65%), and they have the tools they need to successfully do their job (63%).
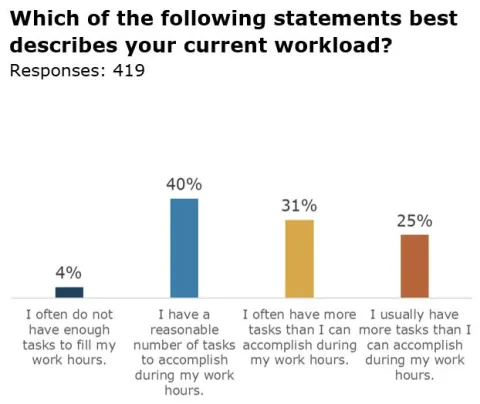
When we asked about workload, about one in two Library employees (56%) report that they often or usually have more work tasks than they can accomplish during their work hours.
Staffing and career advancement emerged as areas of concern. About one in four Library employees (25%) responded that they agree or strongly agree that their primary work team is adequately staffed. Similarly, one in four Library employees (27%) reported that they have opportunities and support for career advancement.
When we analyzed responses to "Overall I feel supported in my role" by demographic groups, we found that:- There were differences when we analyzed responses by Library Areas. Employees in Location Services showed the least agreement with feeling supported in their role (41% agree or strongly agree) and Administration and Management showed the highest agreement (94% agree or strongly agree). - There were also differences based on classification. Employees in the following classifications showed agreement with feeling supported in their roles: Manager (69% agree or strongly agree) and Librarian (63% agree or strongly agree). Employees in the Library Safety Liaison (22% agree or strongly agree), Library Clerk (26% agree or strongly agree), and Library Assistant (40% agree or strongly agree) classifications showed the least agreement with feeling supported in their role.
When we analyzed responses to "Which of the following statements best describes your current workload?" by demographic groups, we found that:
- Native American or Alaskan Native (67%) and Black/African American employees (63%) reported a slightly higher rate of often or usually having more tasks than they can accomplish, compared to 55% among White employees- Among most Library Areas, responses were similar with about 56% employees reporting that they have more tasks than they can accomplish. However, this was slightly higher among Integrated Services employees, with 74% of Integrated Services employees reporting that they often or usually have more tasks than they can accomplish.
When we analyzed responses to "My primary work team is adequately staffed" by demographic groups, we found that:
- There were some differences based on race and ethnicity. About 55% of White employees responded that they disagree or strongly disagree that their primary work team is adequately staffed. This was higher among employees that identify as African (75%), Asian (60%), and Black/African American (74%) - There were also some differences among Library Areas. Most Location Services (58%) and Community Services (57%) employees disagreed or strongly disagreed that their primary work team is adequately staffed, compared to 22% disagreement among Administration and Management employees.
When we analyzed responses to "My role and responsibilities are clear to me" by demographic groups, we found that:- There were some differences when we looked by whether employees have a cultural or language KSA designation attached to their role. About 54% of employees with a cultural or language KSA believe their roles and responsibilities are clear to them, compared to 67% of employees that do not have a KSA attached to their role.
When we analyzed responses to "I have the tools I need to successfully do my job." by demographic groups, we found that:9 There were some differences based on Library Area. About 54% of Location Services employees agree or strongly agree to having the tools they need, compared to 70 agreement among employees in Community Services, 74% agreement among employees in Integrated Services, and 100% agreement among Administration and Management employees.
When we analyzed responses to "I have opportunities and support for career advancement." by demographic groups, we found that:- There were some differences by race and ethnicity. There was higher agreement with this statement among Latino (41%) and Native American or Alaskan Native (56%) employees, though still under 50% for nearly all racial and ethnic groups. - This was consistent with employees with language and cultural KSA designations. About 41% of employees with a language and cultural KSAs report they have opportunities for advancement, compared to 23% of non-KSA employees. There was wide variation when we looked by specific KSAs. This may indicate that the KSA designation provides career advancement opportunities, though not consistently among different KSA designations.
What is one systemic or structural change that you think the Library could implement to improve morale and/or trust?There were 314 responses to this question. The top themes were: - Improving transparency, communication, and decision making (41%)- Accountability of leadership for their decisions or changing leadership (32%)- More onsite presence of middle or upper management at branches. (16%)- Supporting and valuing staff or providing better pay or job opportunities. (20%)- Acknowledging safety issues. (13%)
Quotes from the survey include: "Transparency, and improved communication. As a frontline staff member, I do not feel that I am given enough information in a timely manner to do my job or to trust that administrators have my, my colleagues, or our patron's best interests at heart." "New leadership is my number one recommendation..." "Have members of EMT [Executive Management Team] actually visit and work at all the branches on a regular, ongoing basis.... A lot of the distrust and low morale is because those of us who work on the front lines feel as though EMT doesn't understand the reality of the work we do as they never experience it. They are the ones that make the decisions, yet don't participate in the actual day to day work of those on the front lines." "Most of us who work on the ground are severely underpaid for the work we do, we are acting as therapists and social workers often in this role. We are fatigued and not supported. Staff of color should have additional time off to supplement for the violences we face. Take us seriously, value us genuinely..." "Better communication around safety incidents including steps taken by the Library to support staff and patrons that were affected by a security incident in the library..."
Safety and Security
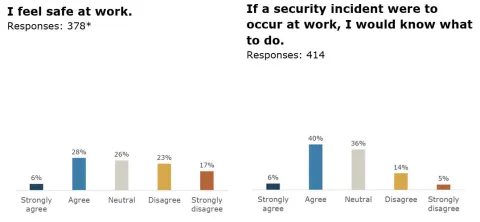
Overall, about 34% of Library employees responded that they agreed or strongly agreed that they feel safe at work. Employees were mixed about security measures. This section had higher neutral responses compared to other parts of the employee survey.
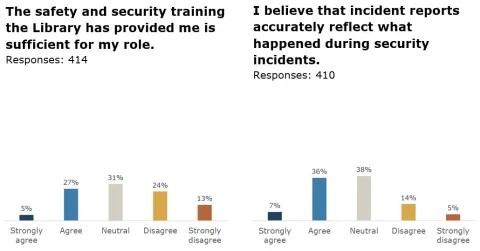
For example, when we asked about safety and security trainings, employee responses were nearly evenly split. About one in three employees (32%) of employees agree or strongly agree that the training they receive is adequate for their role, one in three (31%) are neutral, and the remaining (38%) disagree or strongly disagree.
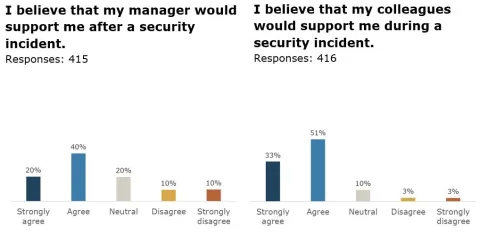
Most employees reported that they believe that their colleagues (84%) and manager (60%) would support them after a security incident. This may indicate that managers and peers may serve as a source of support for employees.
When we analyzed responses to "I feel safe at work." by demographic groups, we found that:
- These were some differences by race and ethnicity. About 12% of Asian employees and 26% of Black/African American employees responded that they agree or strongly agree with feeling safe at work, compared to 34% of White employees. - When we looked by classification, about 51% of Managers reported feeling safe, compared to 16% of Library Assistants and 31% of Library Access Service Assistants.
When we analyzed responses to "The safety and security training the Library has provided me is sufficient for my role" by demographic groups, we found that:- There were differences based on classification. About 22% of Library Safety Liaisons agreed or strongly agreed that the safety and security training is sufficient for their role, while 56% disagree, and 22% responded as neutral. - The lowest agreement to the statement was among Library Assistants (18% agree or strongly agree) The highest agreement was among Managers (57% agree or strongly agree).
What would help you feel safer at work?There were 284 respondents that left a response to this question. The top themes were: - Increasing onsite professional security (52%)- Having adequate staffing (13%)- Executive leadership taking security more seriously and improving their response (13%)- Improving security training (11%)
Quotes from the survey include: "To have well trained special professional staff responsible for security" "I do not believe I should be required to be the PIC [person in charge] in my role. I would feel safer if managers and people who want to be in security roles take leads on incidents." "More involved and responsive management and sufficient staffing." "...examining what went wrong in a situation, what could be done better? Does staff need trauma counseling and support? Time off to process event? And openness as to what occurred and what lessons we learned. Also, I would like acknowledgement that things need to change." "...Would appreciate more training on what we can and cannot do when a patron turns violent--beyond calling 911--which rarely (if ever) come."