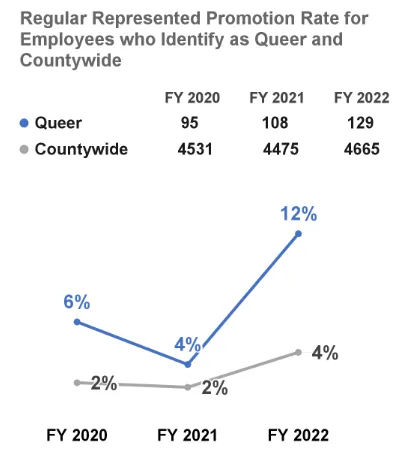
A line graph with fiscal year 2020, 2021, and 2022 on the x-axis, and promotion rate of queer and countywide regular represented employees on the y-axis.
For queer represented employees, in fiscal year 2020 (95), fiscal year 2021 (108), and fiscal year 2022 (129)--the promotion rate was (6%), (4%), and (12%), respectively.
For countywide non-represented employees, in fiscal year 2020 (4531), fiscal year 2021 (4475), and fiscal year 2022 (4665)--the promotion rate was (2%), (2%), and (4%), respectively.