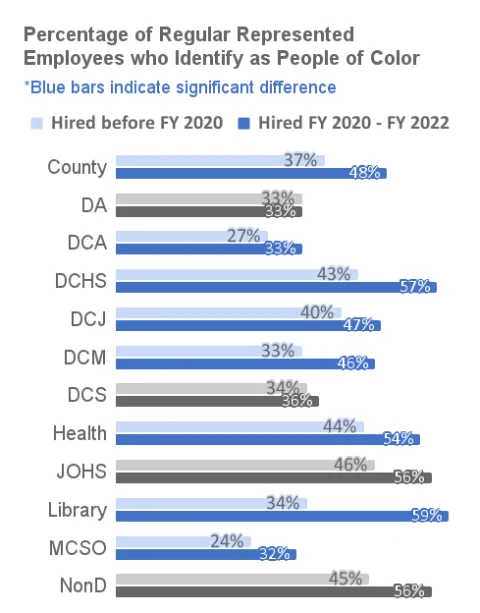
A horizontal bar graph with department on the x-axis and percentage of regular represented employees who identify as people of color on the y-axis, showing separate bars for employees hired before fiscal year 2020 and employees hired between fiscal years 2020-2022.
County, hired before fiscal year 2020 (37%), hired fiscal year 2020-2022 (48%)
DA, hired before fiscal year 2020 (33%), hired fiscal year 2020-2022 (33%)
DCA, hired before fiscal year 2020 (27%), hired fiscal year 2020-2022 (33%)
DCHS, hired before fiscal year 2020 (43%), hired fiscal year 2020-2022 (57%)
DCJ, hired before fiscal year 2020 (40%), hired fiscal year 2020-2022 (47%)
DCM, hired before fiscal year 2020 (33%), hired fiscal year 2020-2022 (46%)
DCS, hired before fiscal year 2020 (34%), hired fiscal year 2020-2022 (36%)
Health, hired before fiscal year 2020 (44%), hired fiscal year 2020-2022 (54%)
JOHS, hired before fiscal year 2020 (46%), hired fiscal year 2020-2022 (56%)
Library, hired before fiscal year 2020 (34%), hired fiscal year 2020-2022 (59%)
MCSO, hired before fiscal year 2020 (24%), hired fiscal year 2020-2022 (32%)
NonD, hired before fiscal year 2020 (45%), hired fiscal year 2020-2022 (56%)
There were statistically significant increases in the percentage of employees who identified as people of color for the County, DCA, DCHS, DCJ, DCM, Health, Library, and MCSO, but not for DA, DCS, JOHS, or NonD.