Multnomah County believes that the protection of the environment is essential to the health and well-being of communities. The County has made substantial progress implementing Board-adopted sustainability policies at the community scale and in the way it does business. This report summarizes the County's progress in reducing environmental impacts from its operations.
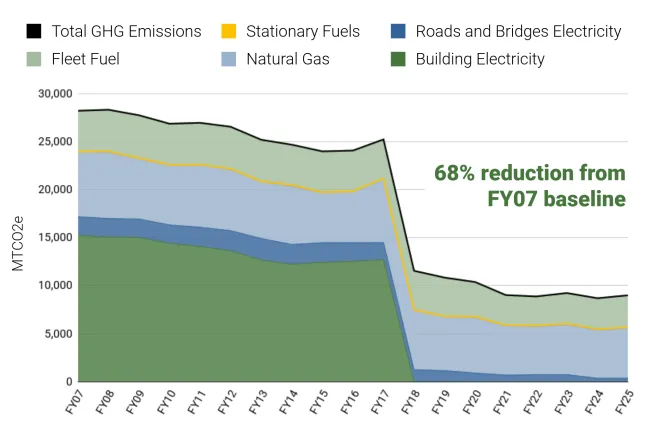
Total Scope 1 & 2 Greenhouse Gas Emissions
Goal: By 2030, reduce greenhouse gas emissions from County operations by 53 percent from FY07 levels. [ACHIEVED]
Greenhouse gas (GHG) emissions in FY25 were 68 percent below the FY07 baseline year due to more efficient operations and the use of renewable sources of electricity. Emissions have remained flat for the past several years, and more work is needed to reduce emissions from natural gas use in existing buildings and transportation fuels from the County’s fleet.
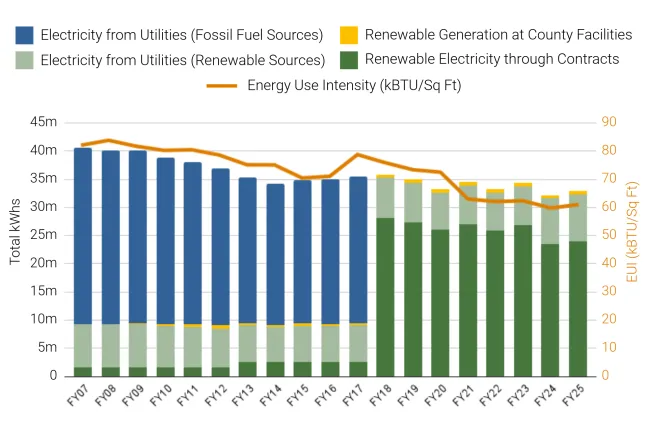
Building Energy Efficiency & Electricity
Goal: Obtain 100 percent of electricity used at County facilities from renewable energy sources through a combination of on-site renewable electricity generation, utility- supplied renewables, dedicated off-site renewable resources, and renew- able energy credits (RECs). [ACHIEVED]
Electricity from the grid is becoming cleaner over time, and the County purchases renewable electricity through contracts to reduce the remaining greenhouse gas emissions from its electricity use. The County also adds on-site energy generation in the form of rooftop solar to new buildings when feasible. In FY25 the County used 100 percent renewable sources of electricity and 20 percent less electricity overall when compared to FY07 baseline.
Energy Use Intensity (EUI) measures total building energy use (natural gas and electricity) per square foot, showing how efficiently buildings are operated over time. Through energy efficiency investments in existing buildings and innovative design of new buildings, EUI across the County portfolio is 26 percent below the FY07 baseline.
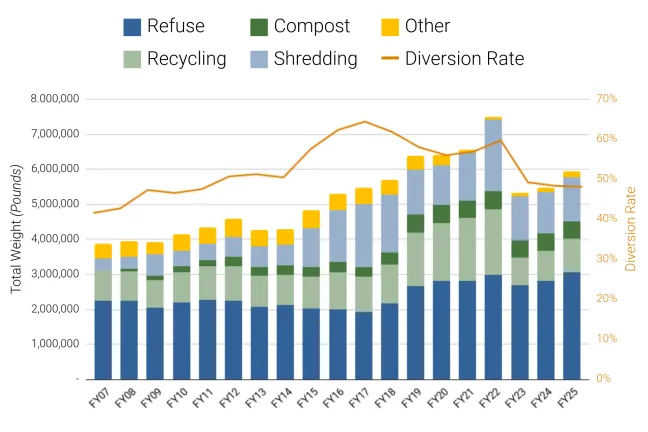
Solid Waste & Recycling
GOAL: To reduce total waste 12.5 percent below FY09-10 levels and recover 65 percent of all waste generated by County operations. [OFF TARGET]
The amount of waste generated and discarded continues to be a major challenge. In FY23 a new tracking method was implemented to track solid waste. That new method is the reason for the decrease of solid waste in FY23, not less actual waste generation. Over the past three years, the overall trend has been an increase in total waste and a decrease in the total amount of recycling and composting diverted from the landfill. In FY25, the County generated 52 percent more solid waste compared to the FY09 baseline, but maintained the same 48 percent diversion rate. Additional operational changes and renewed staff engagement is needed to improve this metric.
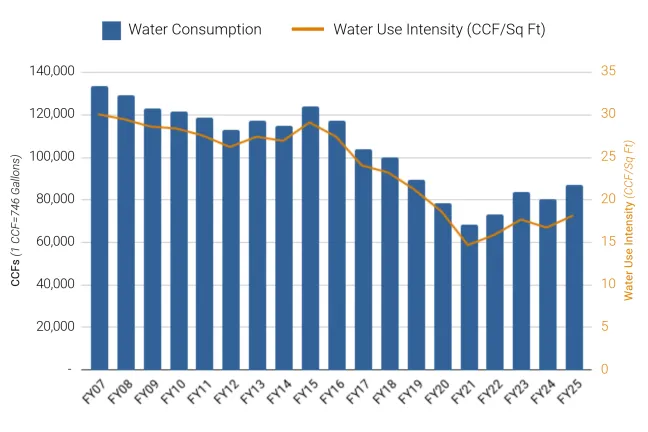
Water Conservation
Multnomah County has not established a water savings goal, however, it aims to reduce potable water use over time to save money and increase resilience.
The County’s water use saw its lowest point in FY21. Fewer people were using County-owned buildings during the pandemic resulting in lower water use. Since then water use has been relatively flat since FY23, when the number of people in County buildings returned to more normal levels. This is despite the County adding more residential buildings to its portfolio, which have higher water demands, and higher average temperatures, which increases cooling load. The County’s major facilities use cooling systems that consume both water and energy. In FY25, the County used 33 percent less water than the FY07 baseline.
Water Use Intensity (WUI) is similar to EUI, indicating how efficiently water is used per square foot across the portfolio. By this measure, in FY25 the County is using water 39 percent more efficiently on a per square foot basis, despite the challenge noted above.