Separation Rate for Regular Represented Bisexual Employees

Separation Rate for Regular Represented Bisexual Employees

This page includes documents or other content that may not meet accessibility standards.

This page includes documents or other content that may not meet accessibility standards.

Documents marked “archived” may not work with assistive technologies. Request content in an accessible format.

Separation Rate for Regular Represented Bisexual Employees
Separation Rate for Regular Represented Bisexual Employees. (Click for long image description)

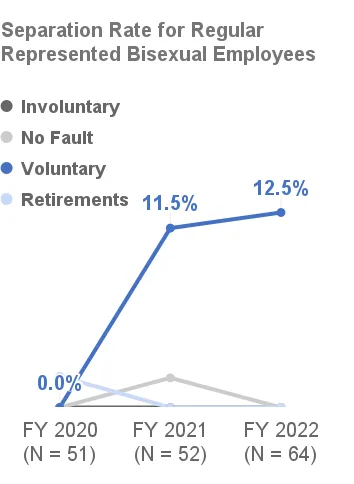
A line graph with fiscal year 2020 (N=51), 2021 (N=52), and 2022 (N=64) on the x-axis,  and separation rate by type for bisexual regular represented employees on the y-axis.

In fiscal year 2020, involuntary separations (0%), no fault separations (0%), voluntary separations (0%),  and retirement (2%).

In fiscal year 2020, involuntary separations (0%), no fault separations (01.9%), voluntary separations (11.5%),  and retirement (0%).

In fiscal year 2020, involuntary separations (0%), no fault separations (0%), voluntary separations (12.5%),  and retirement (0%).

Last reviewed June 22, 2023