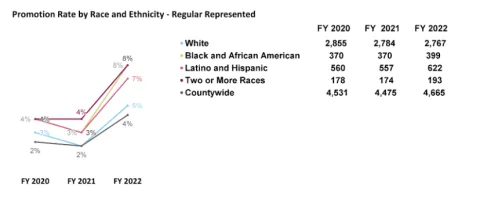
A line graph with fiscal year 2020, 2021, and 2022 on the x-axis, and promotion rate by race and ethnicity of regular represented employees on the y-axis.
For White regular represented employees, in fiscal year 2020 (2855), fiscal year 2021 (2784), and fiscal year 2022 (2767)--the promotion rate was (3%), (2%), and (5%), respectively.
For Black and African American regular represented employees, in fiscal year 2020 (370), fiscal year 2021 (370), and fiscal year 2022 (399)--the promotion rate was (4%), (3%), and (8%), respectively.
For Latino and Hispanic regular represented employees, in fiscal year 2020 (560), fiscal year 2021 (557), and fiscal year 2022 (622)--the promotion rate was (4%), (3%), and (7%), respectively.
For Two or More Races regular represented employees, in fiscal year 2020 (178), fiscal year 2021 (174), and fiscal year 2022 (193)--the promotion rate was (4%), (4%), and (8%), respectively.
For Countywide regular represented employees, in fiscal year 2020 (4531), fiscal year 2021 (4475), and fiscal year 2022 (4665)--the promotion rate was (2%), (2%), and (4%), respectively.