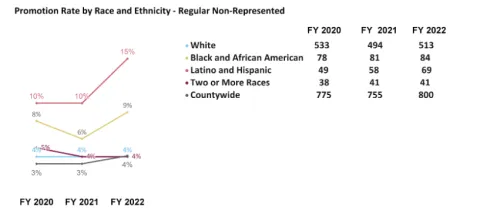
A line graph with fiscal year 2020, 2021, and 2022 on the x-axis, and promotion rate by race and ethnicity of regular non-represented employees on the y-axis.
For White regular non-represented employees, in fiscal year 2020 (533), fiscal year 2021 (494), and fiscal year 2022 (513)--the promotion rate was (4%), (4%), and (4%), respectively.
For Black and African American regular non-represented employees, in fiscal year 2020 (78), fiscal year 2021 (81), and fiscal year 2022 (84)--the promotion rate was (8%), (6%), and (9%), respectively.
For Latino and Hispanic regular non-represented employees, in fiscal year 2020 (49), fiscal year 2021 (58), and fiscal year 2022 (69)--the promotion rate was (10%), (10%), and (15%), respectively.
For Two or More Races regular non-represented employees, in fiscal year 2020 (38), fiscal year 2021 (41), and fiscal year 2022 (41)--the promotion rate was (5%), (4%), and (4%), respectively.
For Countywide regular non-represented employees, in fiscal year 2020 (775), fiscal year 202