Limited Duration Employees Separation and Hire Rate

Limited Duration Employees Separation and Hire Rate

This page includes documents or other content that may not meet accessibility standards.

This page includes documents or other content that may not meet accessibility standards.

Documents marked “archived” may not work with assistive technologies. Request content in an accessible format.

Limited Duration Employees Separation and Hire Rate

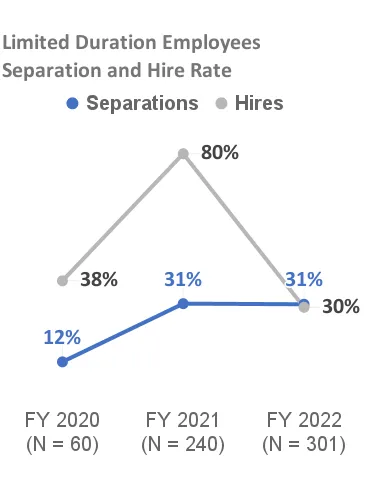
A line graph with fiscal year 2020 (N = 60), 2021 (N = 240), and 2022 (N = 301) on the x-axis,  and hire and separation rate of limited duration employees on the y-axis.

The hiring rate in fiscal year 2020 (38%), 2021 (80%), and 2022 (30%). The separation rate in fiscal year 2020 (12%), 2021 (31%), and 2022 (31%).

Last reviewed June 23, 2023