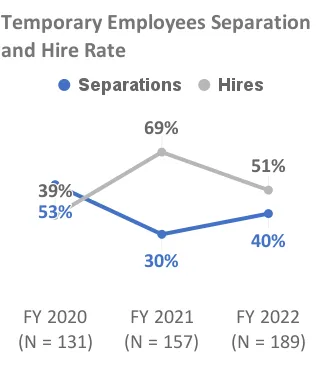
A line graph with fiscal year 2020 (N = 131), 2021 (N = 157), and 2022 (N = 189) on the x-axis, and race, and hire and separation rate of temporary employees on the y-axis.
The hiring rate in fiscal year 2020 (39%), 2021 (69%), and 2022 (51%). The separation rate in fiscal year 2020 (53%), 2021 (30%), and 2022 (40%).