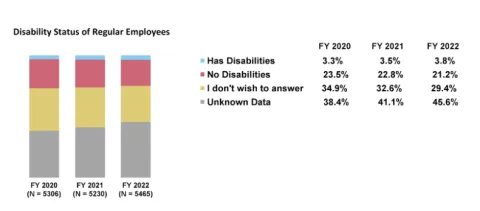
A stacked bar chart with fiscal year 2020 (N = 5306), 2021 (N = 5230), and 2022 (N = 5465) on the x-axis, and disability status of regular employees on the y-axis.
In fiscal year 2020, Has Disabilities(3.3%), No Disabilities (23.5%), I Don’t Wish to Answer(34.9%), and Unknown Data (38.4%).
In fiscal year 2021, Has Disabilities(3.5%), No Disabilities (22.8%), I Don’t Wish to Answer(32.6%), and Unknown Data (41.1%).
In fiscal year 2022, Has Disabilities(3.8%), No Disabilities (21.2%), I Don’t Wish to Answer(29.4%), and Unknown Data (45.6%).