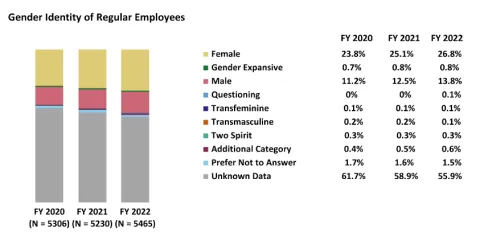
A stacked bar chart with fiscal year 2020 (N = 5306), 2021 (N = 5230), and 2022 (N = 5465) on the x-axis, and gender identity of regular employees on the y-axis.
In fiscal year 2020, Female (23.8%), Gender Expansive (0.7%), Male (11.2%), Questioning (0%), Transfeminine (0.1%), Transmasculine (0.2%), Two Spirit (0.3%), Additional Category (0.4%). Prefer Not to Answer (1.7%), and Unknown Data (61.7%).
In fiscal year 2021, Female (25.1%), Gender Expansive (0.8%), Male (12.5%), Questioning (0%), Transfeminine (0%), Transmasculine (0.1%), Two Spirit (0.2%), Additional Category (0.5%), Prefer Not to Answer (1.6%), and Unknown Data (58.9%).
In fiscal year 2022, Female (26.8%), Gender Expansive (0.7%), Male (0.8%), Questioning (0.1%), Transfeminine (0.1%), Transmasculine (0.1%), Two Spirit (0.3%), Additional Category (0.6%). Prefer Not to Answer (1.5%), and Unknown Data (55.9%).