A line graph with fiscal year 2020 (N = 70), 2021 (N = 118), and 2022 (N = 152) on the x-axis, and race, and hire rate of temporary employees on the y-axis.
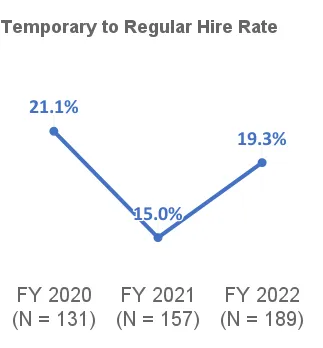
The hiring rate in fiscal year 2020 (21.1%), 2021 (15%), and 2022 (19.3%).
Temporary to Regular Hire Rate
A line graph with fiscal year 2020 (N = 70), 2021 (N = 118), and 2022 (N = 152) on the x-axis, and race, and hire rate of temporary employees on the y-axis.
The hiring rate in fiscal year 2020 (21.1%), 2021 (15%), and 2022 (19.3%).