Veteran Status of Regular Employees

A bar graph showing the percentage of employees who identify at Veterans in FY 2020 was 1.2%, in FY 2021 was 2.1%, and in FY 2022 was 2.8%.

This page includes documents or other content that may not meet accessibility standards.

This page includes documents or other content that may not meet accessibility standards.

Documents marked “archived” may not work with assistive technologies. Request content in an accessible format.

A bar graph showing the percentage of employees who identify at Veterans in FY 2020 was 1.2%, in FY 2021 was 2.1%, and in FY 2022 was 2.8%.
Veteran Status of Regular Employees

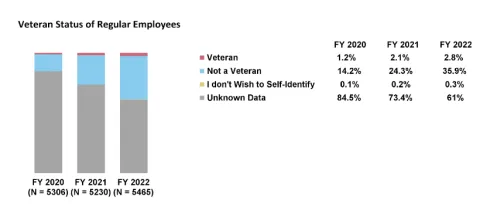
A line graph with fiscal year 2020 (N=5306), 2021 (N=5230), and 2022 (N=5465) on the x-axis,  and veteran status for regular employees on the y-axis.

In fiscal year 2020, veteran (1.2%), not a veteran (14.2%), I don’t wish to self-identify (0.1%), and unknown data (84.5%).

In fiscal year 2021, veteran (2.1%), not a veteran (24.3%), I don’t wish to self-identify (0.2%), and unknown data (73.4%).

In fiscal year 2022, veteran (2.8%) not a veteran (35.9%), I don’t wish to self-identify (0.3%), and unknown data (61%).

Last reviewed June 22, 2023