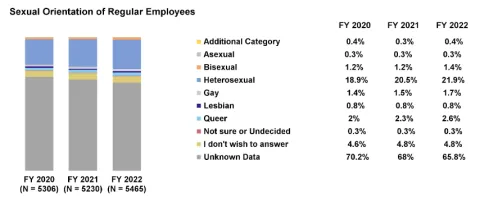
A stacked bar chart with fiscal year 2020 (N = 5306), 2021 (N = 5230), and 2022 (N = 5465) on the x-axis, and sexual orientation of regular employees on the y-axis.
In fiscal year 2020, Additional Category (0.4%), Asexual (0.3%), Bisexual (1.2%), Heterosexual (18.9%), Gay (1.4%), Lesbian (0.8%), Queer (2%), Not Sure or Undecided (0.3%), I do Not Wish to Answer (4.8%), and Unknown Data (70.2%).
In fiscal year 2021, Additional Category (0.3%), Asexual (0.3%), Bisexual (1.2%), Heterosexual (20.5%), Gay (1.5%), Lesbian (0.8%), Queer (2.3%), Not Sure or Undecided (0.3%), I do Not Wish to Answer (4.8%), and Unknown Data (68%).
In fiscal year 2022, Additional Category (0.4%), Asexual (0.3%), Bisexual (1.4%), Heterosexual (21.9%), Gay (1.7%), Lesbian (0.8%), Queer (2.6%), Not Sure or Undecided (0.3%), I do Not Wish to Answer (4.8%), and Unknown Data (65.8%).