Workforce Demographics, FY 2020 - FY 2024 County Regular Workforce by Race and Ethnicity
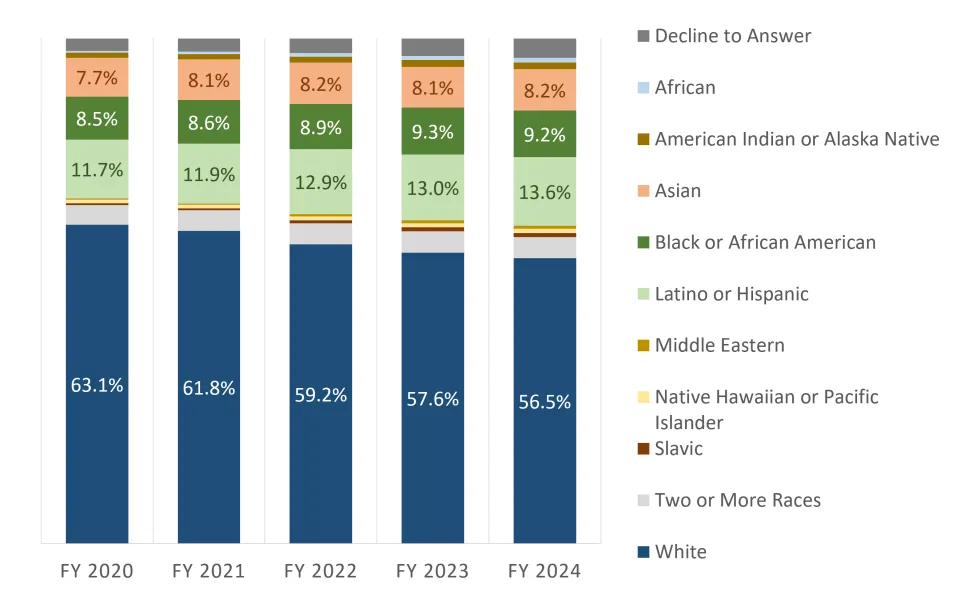
Figure 6: Multnomah County regular workforce by race and ethnicity, FY 2020 - FY 2024
Fiscal Year Decline to Answer White Two or More Races Slavic Native Hawaiian or Pacific Islander Middle Eastern Latino or Hispanic Black or African American Asian American Indian or Alaska Native African FY 2020 2.5% 63.1% 3.9% 0.4% 0.7% 0.2% 11.7% 8.5% 7.7% 1.0% 0.3% FY 2021 2.6% 61.8% 4.1% 0.4% 0.7% 0.2% 11.9% 8.6% 8.1% 1.0% 0.5% FY 2022 2.9% 59.2% 4.2% 0.6% 0.8% 0.4% 12.9% 8.9% 8.2% 1.2% 0.7% FY 2023 3.5% 57.6% 4.2% 0.8% 0.8% 0.6% 13.0% 9.3% 8.1% 1.3% 0.8% FY 2024 3.8% 56.5% 4.2% 0.8% 0.8% 0.6% 13.6% 9.2% 8.2% 1.3% 1.0%
County Regular Workforce by Gender Identity
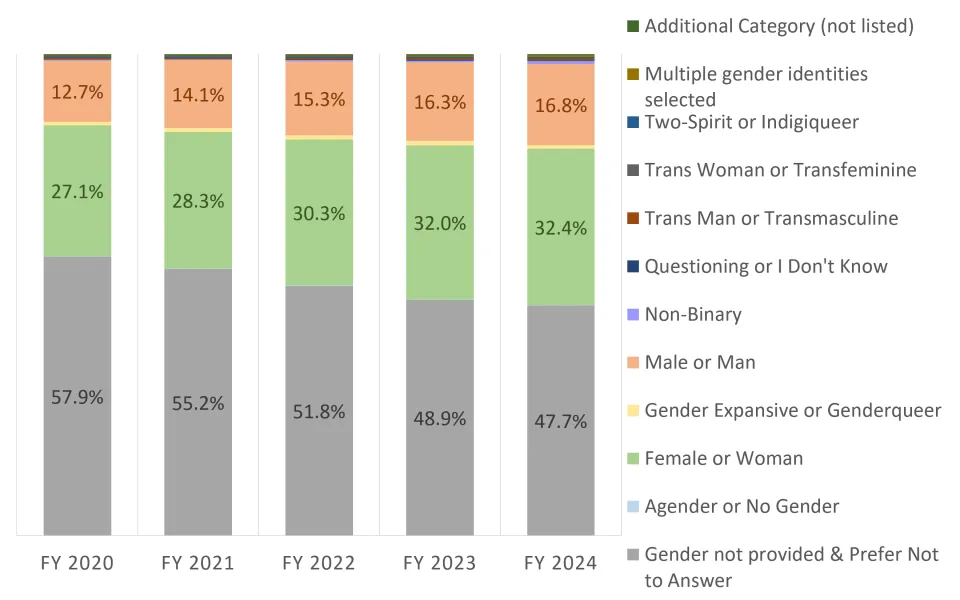
Figure 7: Multnomah County regular workforce by gender identity, FY 2020 - FY 2024
Fiscal Year Gender not provided & Prefer Not to Answer Agender or No Gender Female or Woman Gender Expansive or Genderqueer Male or Man Non-Binary Questioning or I Don't Know Trans Man or Transmasculine Trans Woman or Transfeminine Two-Spirit or Indigiqueer Multiple gender identities selected Additional Category (not listed) FY 2020 57.9% 0.1% 27.1% 0.8% 12.7% 0.2% 0.0% 0.3% 0.1% 0.3% 0.1% 0.4% FY 2021 55.2% 0.1% 28.3% 0.8% 14.1% 0.2% 0.0% 0.2% 0.1% 0.3% 0.1% 0.4% FY 2022 51.8% 0.1% 30.3% 0.9% 15.3% 0.3% 0.1% 0.3% 0.1% 0.3% 0.1% 0.4% FY 2023 48.9% 0.1% 32.0% 1.0% 16.3% 0.3% 0.1% 0.3% 0.1% 0.3% 0.2% 0.4% FY 2024 47.7% 0.1% 32.4% 0.8% 16.8% 0.6% 0.1% 0.3% 0.1% 0.3% 0.4% 0.3%
County Regular Workforce by Sexual Orientation
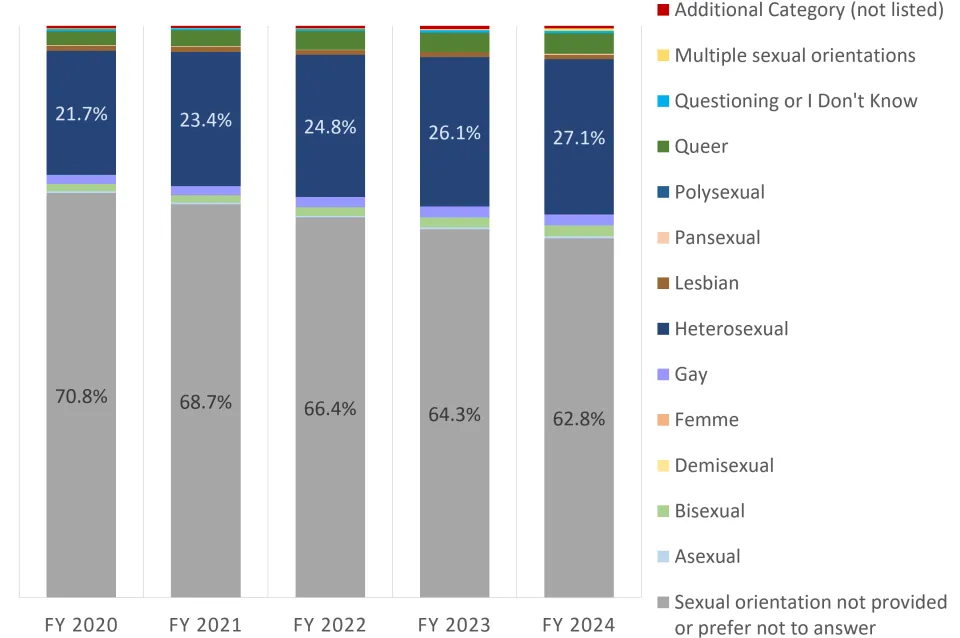
Figure 8: Multnomah County regular workforce by sexual orientation, FY 2020 - FY 2024
Fiscal Year Sexual orientation not provided or prefer not to answer Asexual Bisexual Demisexual Femme Gay Heterosexual Lesbian Pansexual Polysexual Queer Questioning or I Don't Know Multiple sexual orientations Additional Category (not listed) FY20 70.8% 0.3% 1.3% 0.0% 0.0% 1.6% 21.7% 0.9% 0.1% 0.0% 2.4% 0.4% 0.1% 0.5% FY21 68.7% 0.3% 1.3% 0.0% 0.0% 1.6% 23.4% 0.9% 0.1% 0.0% 2.8% 0.3% 0.1% 0.4% FY22 66.4% 0.3% 1.5% 0.0% 0.0% 1.8% 24.8% 0.8% 0.1% 0.0% 3.3% 0.3% 0.1% 0.5% FY23 64.3% 0.4% 1.7% 0.0% 0.0% 1.9% 26.1% 0.9% 0.0% 0.0% 3.4% 0.4% 0.2% 0.6% FY24 62.8% 0.4% 1.9% 0.0% 0.0% 1.9% 27.1% 0.8% 0.2% 0.0% 3.6% 0.4% 0.4% 0.5%
County Regular Workforce by Disability Status
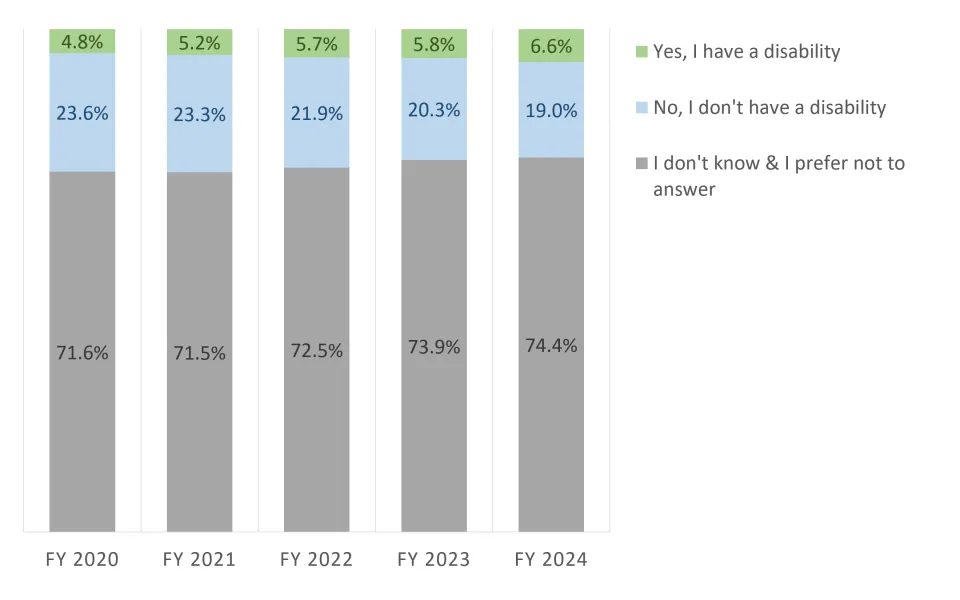
Figure 9: Multnomah County regular workforce by disability status, FY 2020 - FY 2024
Fiscal Year I don't know & I prefer not to answer No, I don't have a disability Yes, I have a disability FY 2020 71.6% 23.6% 4.8% FY 2021 71.5% 23.3% 5.2% FY 2022 72.5% 21.9% 5.7% FY 2023 73.9% 20.3% 5.8% FY 2024 74.4% 19.0% 6.6%
County Regular Workforce by Generation
Figure 10: Multnomah County regular workforce by generation, FY 2020 - FY 2024
Fiscal Year Generation not provided Silent Generation Baby Boomer Generation X Millennial Generation Z FY 2020 0.0% 0.1% 21.2% 47.5% 30.8% 0.4% FY 2021 0.0% 0.0% 18.8% 47.8% 32.6% 0.7% FY 2022 0.0% 0.0% 16.0% 46.6% 35.3% 2.0% FY 2023 0.0% 0.0% 14.1% 44.6% 37.7% 3.6% FY 2024 0.0% 0.0% 12.4% 43.9% 38.9% 4.8%
County Regular Workforce by Military Status No graph is provided for military status due to high levels of missing information.
Table 2: Multnomah County regular workforce by veteran status, FY 2020 - FY 2024 Fiscal Year Unknown or decline to state No, I have not served in the US Military Yes, I have served in the US Military FY20 96.5% 0.3% 3.2% FY21 96.3% 0.4% 3.4% FY22 96.3% 0.4% 3.3% FY23 96.2% 0.6% 3.3% FY24 95.1% 1.6% 3.4%
Back to Report, Part 1: Introduction and Employee Demographics
Back to Report Homepage
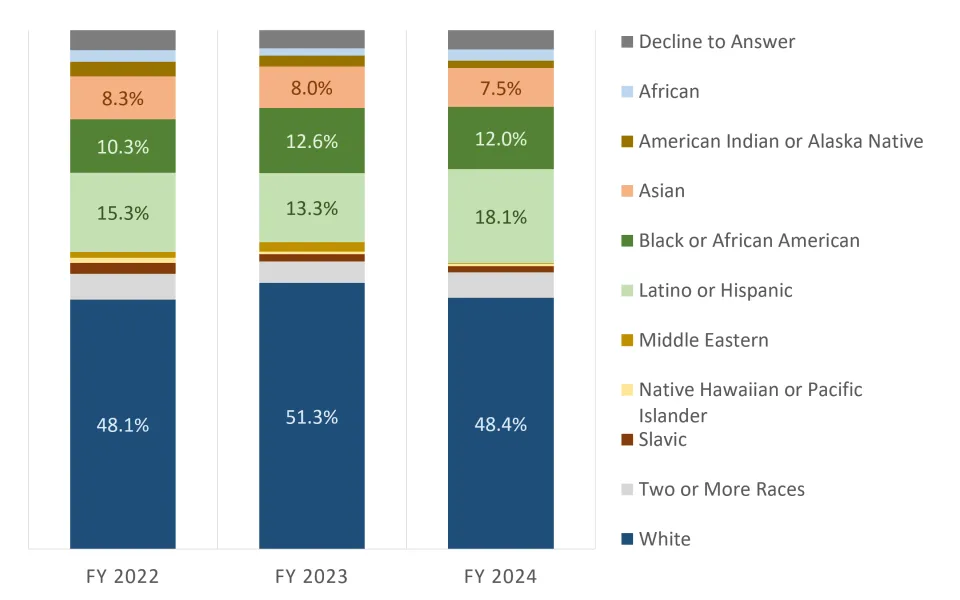
Demographics of Hires, FY 2022 - FY 2024 Hires by Race and Ethnicity
Figure 12: Multnomah County hires by race and ethnicity, FY 2022 - FY 2024
Fiscal Year Decline to Answer White Two or More Races Slavic Native Hawaiian or Pacific Islander Middle Eastern Latino or Hispanic Black or African American Asian American Indian or Alaska Native African FY 2022 3.9% 48.1% 5.0% 2.1% 1.0% 1.1% 15.3% 10.3% 8.3% 2.8% 2.2% FY 2023 3.5% 51.3% 4.2% 1.4% 0.5% 1.8% 13.3% 12.6% 8.0% 2.1% 1.4% FY 2024 3.7% 48.4% 4.9% 1.2% 0.4% 0.2% 18.1% 12.0% 7.5% 1.4% 2.2%
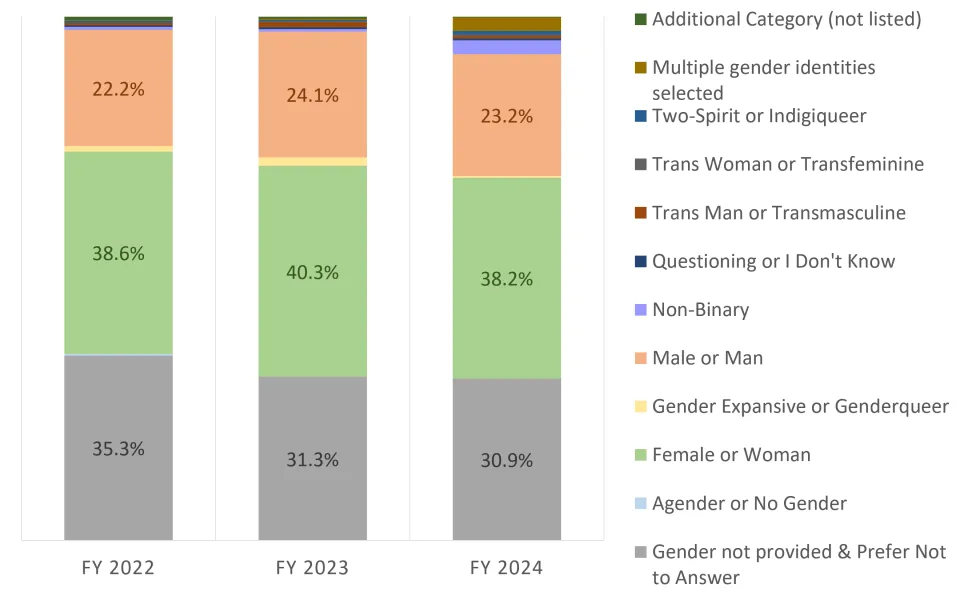
Hires by Gender Identity
Figure 13: Multnomah County hires by gender identity, FY 2022 - FY 2024
Fiscal Year Gender not provided & Prefer Not to Answer Agender or No Gender Female or Woman Gender Expansive or Genderqueer Male or Man Non-Binary Questioning or I Don't Know Trans Man or Transmasculine Trans Woman or Transfeminine Two-Spirit or Indigiqueer Multiple gender identities selected Additional Category (not listed) FY 2022 35.3% 0.3% 38.6% 1.0% 22.2% 0.6% 0.3% 0.4% 0.1% 0.4% 0.1% 0.7% FY 2023 31.3% 0.0% 40.3% 1.6% 24.1% 0.5% 0.3% 1.0% 0.2% 0.2% 0.2% 0.5% FY 2024 30.9% 0.0% 38.2% 0.4% 23.2% 2.6% 0.4% 0.4% 0.4% 0.6% 2.6% 0.2%
Hires by Military Status No graph is provided for military status due to high levels of missing information.
Table 4: Multnomah County regular hires by military status, FY 2022 - FY 2024 Fiscal Year Unknown or decline to state No, I have not served in the US Military Yes, I have served in the US Military FY 2022 95.7% 0.7% 3.6% FY 2023 94.6% 1.8% 3.7% FY 2024 85.0% 9.6% 5.5%
Hires by Sexual Orientation
Figure 14: Multnomah County hires by sexual orientation, FY 2022 - FY 2024
Fiscal Year Sexual orientation not provided or prefer not to answer Asexual Bisexual Demisexual Femme Gay Heterosexual Lesbian Pansexual Polysexual Queer Questioning or I Don't Know Multiple sexual orientations Additional Category (not listed) FY 2022 54.3% 0.4% 3.5% 0.0% 0.0% 2.9% 31.0% 0.8% 0.0% 0.0% 6.1% 0.1% 0.0% 0.8% FY 2023 50.2% 0.8% 2.6% 0.0% 0.0% 2.6% 35.5% 1.9% 0.2% 0.0% 4.2% 1.0% 0.3% 1.0% FY 2024 45.9% 0.8% 3.5% 0.0% 0.0% 2.0% 37.0% 0.4% 1.4% 0.0% 6.1% 0.2% 2.4% 0.2%
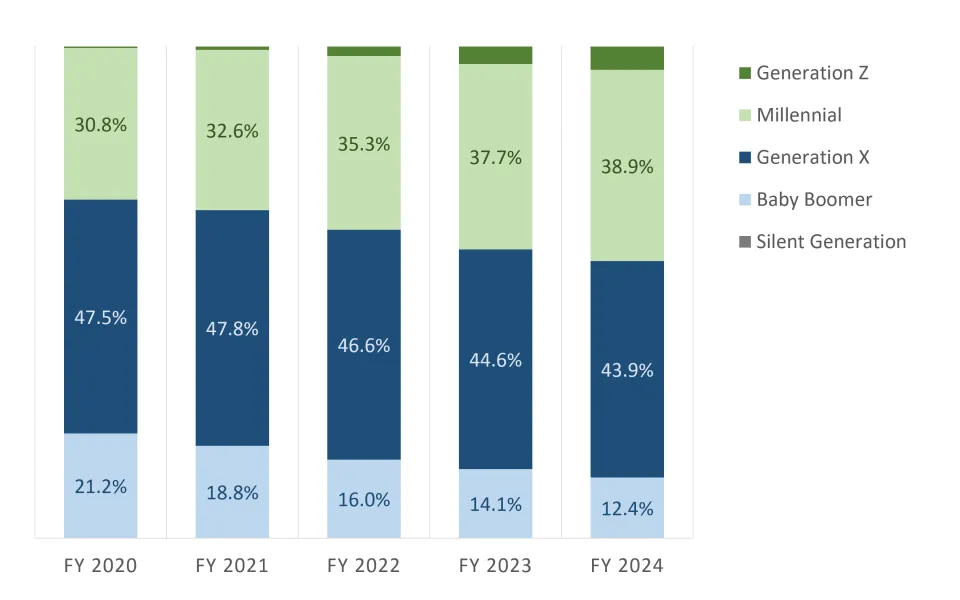
Hires by Generation
Figure 15: Multnomah County hires by generation, FY 2022 - FY 2024
Fiscal Year Generation not provided Silent Generation Baby Boomer Generation X Millennial Generation Z FY 2022 0.4% 0.0% 4.9% 29.2% 54.6% 11.0% FY 2023 0.0% 0.0% 4.5% 29.4% 52.1% 14.1% FY 2024 0.2% 0.0% 3.9% 26.2% 52.2% 17.5%
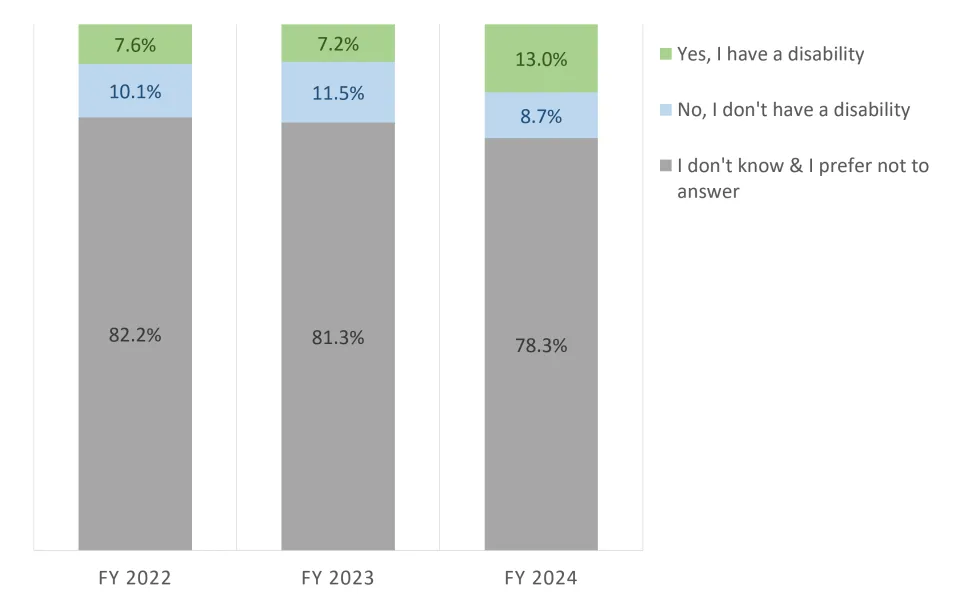
Hires by Disability Status
Figure 16: Multnomah County hires by disability status, FY 2022 - FY 2024
Fiscal Year I don't know & I prefer not to answer No, I don't have a disability Yes, I have a disability FY 2022 82.2% 10.1% 7.6% FY 2023 81.3% 11.5% 7.2% FY 2024 78.3% 8.7% 13.0%
Back to Report, Part 2: Hires, Separations, and other Employment Actions
Back to Report Homepage
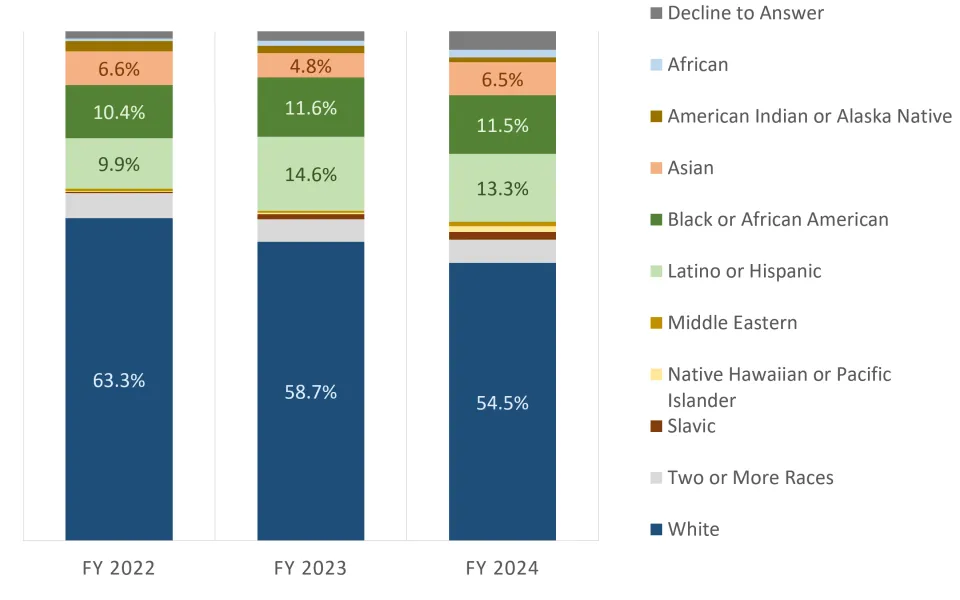
Demographics of Employee Separations, FY 2022 - FY 2024 Separations by Race and Ethnicity
Figure 22: Multnomah County separations by race and ethnicity, FY 2022 - FY 2024
Fiscal Year Decline to Answer White Two or More Races Slavic Native Hawaiian or Pacific Islander Middle Eastern Latino or Hispanic Black or African American Asian American Indian or Alaska Native African FY 2022 1.5% 63.3% 5.0% 0.2% 0.2% 0.5% 9.9% 10.4% 6.6% 2.0% 0.5% FY 2023 1.9% 58.7% 4.4% 1.0% 0.3% 0.3% 14.6% 11.6% 4.8% 1.4% 1.0% FY 2024 3.7% 54.5% 4.6% 1.5% 1.1% 0.9% 13.3% 11.5% 6.5% 0.9% 1.5%
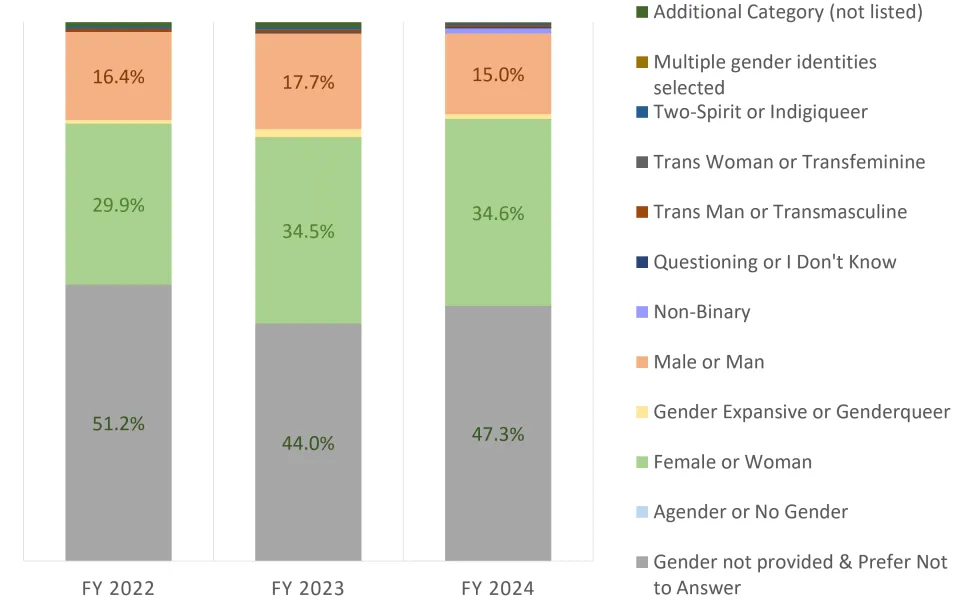
Separations by Gender Identity
Figure 23: Multnomah County separations by gender identity, FY 2022 - FY 2024
Fiscal Year Gender not provided & Prefer Not to Answer Agender or No Gender Female or Woman Gender Expansive or Genderqueer Male or Man Non-Binary Questioning or I Don't Know Trans Man or Transmasculine Trans Woman or Transfeminine Two-Spirit or Indigiqueer Multiple gender identities selected Additional Category (not listed) FY 2022 51.2% 0.0% 29.9% 0.7% 16.4% 0.0% 0.0% 0.5% 0.2% 0.3% 0.0% 0.8% FY 2023 44.0% 0.0% 34.5% 1.5% 17.7% 0.0% 0.2% 0.5% 0.2% 0.3% 0.0% 1.0% FY 2024 47.3% 0.0% 34.6% 0.9% 15.0% 0.9% 0.2% 0.4% 0.0% 0.4% 0.2% 0.0%
Separations by Military Status No graph is provided for military status due to high levels of missing information.
Table 7: Multnomah County regular separations by military status, FY 2022 - FY 2024 Fiscal Year Unknown or decline to state No, I have not served in the US Military Yes, I have served in the US Military FY 2022 95.9% 0.3% 3.8% FY 2023 96.1% 0.0% 3.9% FY 2024 93.5% 2.0% 4.6%
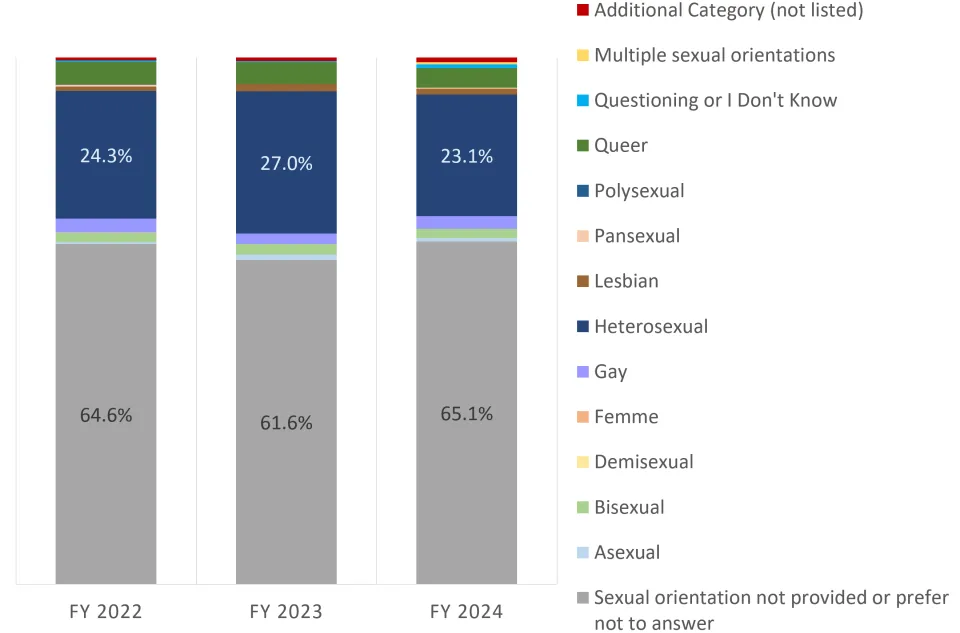
Separations by Sexual Orientation
Figure 24: Multnomah County separations by sexual orientation, FY 2022 - FY 2024
Fiscal Year Sexual orientation not provided or prefer not to answer Asexual Bisexual Demisexual Femme Gay Heterosexual Lesbian Pansexual Polysexual Queer Questioning or I Don't Know Multiple sexual orientations Additional Category (not listed) FY 2022 64.6% 0.3% 1.8% 0.0% 0.0% 2.6% 24.3% 0.8% 0.3% 0.0% 4.3% 0.3% 0.0% 0.5% FY 2023 61.6% 1.0% 2.0% 0.0% 0.0% 2.0% 27.0% 1.4% 0.0% 0.0% 4.1% 0.2% 0.0% 0.7% FY 2024 65.1% 0.7% 1.7% 0.0% 0.0% 2.4% 23.1% 1.1% 0.2% 0.0% 3.7% 0.7% 0.4% 0.9%
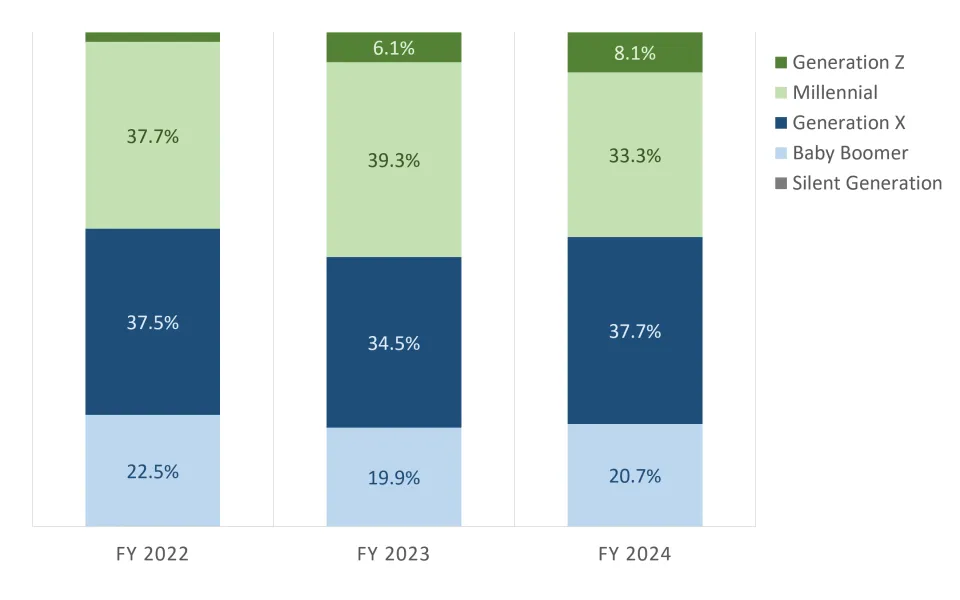
Separations by Generation
Figure 25: Multnomah County separations by generation, FY 2022 - FY 2024
Fiscal Year Generation not provided Silent Generation Baby Boomer Generation X Millennial Generation Z FY 2022 0.3% 0.0% 22.5% 37.5% 37.7% 2.0% FY 2023 0.2% 0.0% 19.9% 34.5% 39.3% 6.1% FY 2024 0.2% 0.0% 20.7% 37.7% 33.3% 8.1%
Separations by Disability Status
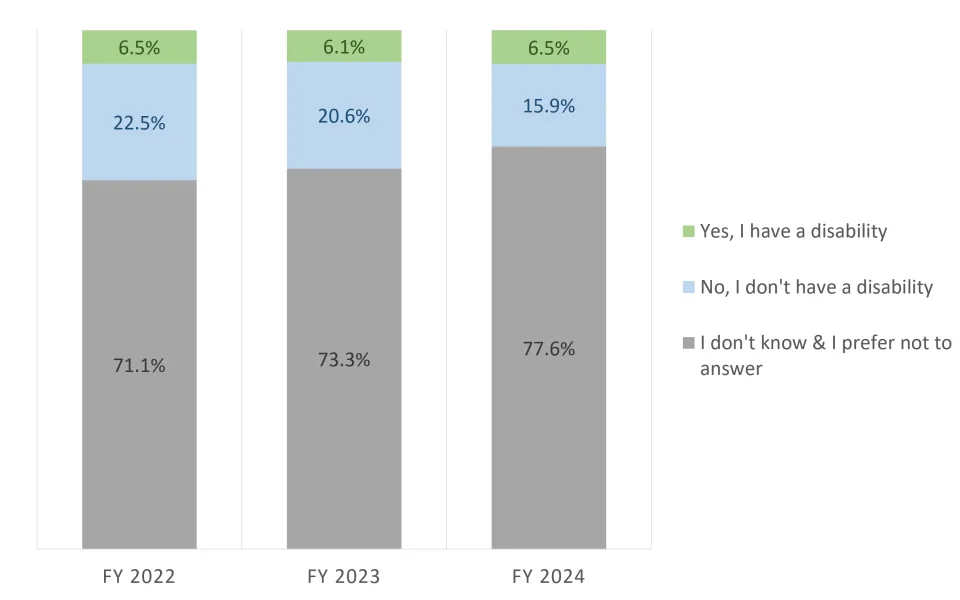
Figure 26: Multnomah County separations by disability status, FY 2022 - FY 2024
Fiscal Year I don't know & I prefer not to answer No, I don't have a disability Yes, I have a disability FY 2022 71.1% 22.5% 6.5% FY 2023 73.3% 20.6% 6.1% FY 2024 77.6% 15.9% 6.5%
Back to Report, Part 1: Introduction and Employee Demographics
Back to Report, Part 2: Hires, Separations, and other Employment Actions
Back to Report Homepage