In addition to separations, hires, and promotions, we also examined other types of employee movements for Regular employees, including limited duration assignments, work out of class or temporary assignments, reclassifications, lead status, and demotions. Many times, limited duration assignments, work out of class and temporary assignments, or lead status represent opportunities for Regular employees to try different roles or to participate in professional development opportunities. We only conducted analyses about Regular employees because not all employee types are eligible for these employee movements.
Since FY 2020, these types of employee movements were relatively infrequent. In order to conduct meaningful analyses, these employee movements were combined over the entire time period from FY 2020 to FY 2022. That is, the rate was calculated by totaling the number of Regular employees who had a limited duration assignment, work out of class or other temporary assignment, reclassification, lead status, or demotion between FY 2020 and FY 2022 and comparing it the total number of Regular employees who were employed at any point between the same time period.
- Limited duration assignments: When a Regular employee takes an assignment that is more than 6 months but less than 2 years; when the assignment ends, the employee has rights to return to their previous job profile. This is different from Limited Duration employees, who are hired from outside the County into a limited duration position. See below for results related to Limited Duration employees.
- Work out of class assignments: When a Regular employee works in a higher job profile for more than 5 days but less than 6 months; the employee usually returns to their previous position unless they are promoted.
- Temporary assignments: When a Regular employee works in an equivalent or lower job profile for more than 5 days but less than 6 months; the employee usually returns to their previous position. This is different from Temporary employees, who are hired from outside the County into a temporary position. See below for results related to Temporary employees.
- Reclassifications: Reclassifications are when a manager or employee requests to change the job profile assigned to an existing position. It may occur when the primary focus of a position has evolved, minimum qualifications have changed, or major duties are added or removed. Reclassification does not always result in a pay grade change or an adjustment in an employees’ rate of pay.
- Demotions: Demotions are when an employee moves to a position of a lower classification. Demotions can be voluntary or involuntary; involuntary demotions are generally a result of disciplinary action.
- Lead status: Lead status is when an employee takes on a lead role on a project or team.
(For the purposes of this report, Work Out of Class and Temporary Assignments were grouped because the data were recorded in Workday in such a way that separating them accurately was not possible.)
Limited Duration Assignments
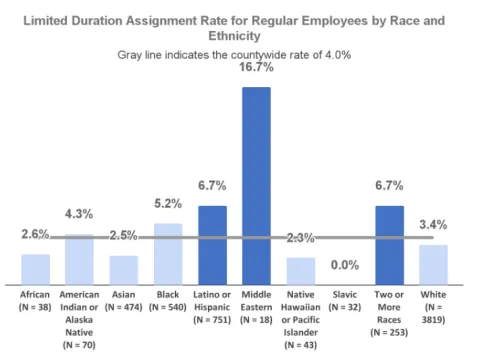
The countywide limited duration assignment rate between FY 2020 and FY 2022 for Regular employees was 4.0%. To better understand the nuances of these results, we examined whether limited duration trends varied among different demographic groups.
We found that for Regular employees, there were statistically significant results in limited duration rates depending on:
- Race and ethnicity
- Gender binary
- Generation
- Veteran status
- Bargaining unit
Countywide, there were no statistically significant limited duration rate results based on other demographic categories for which we had data, including Disability, inclusive Gender Identity, and Sexual Orientation. You may view limited duration data for all demographic groups in the dashboards.
Race and Ethnicity
Between FY 2020 and FY 2022, Latino or Hispanic Regular employees (6.7%), Middle Eastern Regular employees (16.7%) and Regular employees identifying as Two or More Races (6.7%) had statistically significantly higher limited duration assignment rates than the countywide rate (4.0%).
Gender Binary
For these analyses, we used data from the non-inclusive binary “Gender” field in Workday because at this time, it offers fewer missing values than the data from Workday’s more inclusive “Gender Identity” field. However, we recognize that although this data set has fewer missing values, it also may not give employees the ability to accurately represent their gender identity so should be interpreted with caution.
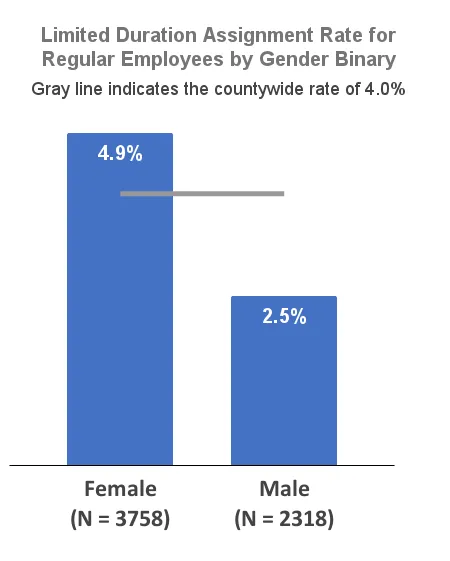
Between FY 2020 and FY 2022, the limited duration assignment rates for Female Regular employees was 4.9%, statistically significantly higher than the countywide rate of 4.0%. At the same time, the rate for Male Regular employees was 2.5%, which is statistically significantly lower than the countywide rate.
Generation
Between FY 2020 and FY 2022, Baby Boomer Regular employees (those born between 1946 and 1964)had statistically significantly lower limited duration assignment rates (2.1%) than the countywide rate of 4.0%. Although the limited duration rate for Generation Z (those born between 1997 and 2012) of 1.9% is lower than the countywide rate, the difference does not reach statistical significance, most likely due to the small number of Generation Z employees countywide.

Veteran Status
Employees’ veteran status is mostly unknown, as more than half of all employees do not have their veteran status entered into Workday. Analyses of employment actions in relation to veteran status can only be performed where this information is known. Therefore, results from these analyses may not accurately reflect the trends for all employees based on their veteran status and should be interpreted with these limitations in mind. We hope to have more complete data about veteran status in the future and we encourage employees to enter their demographic information into Workday.
Nonetheless, there was a statistically significant result for employees who are veterans, Between FY 2020 and FY 2022, there were no Regular employees who are veterans who had limited duration assignment (0%), which is statistically significantly lower than the countywide limited duration assignment rate of 4.0%.
Bargaining Unit
Between FY 2020 and FY 2022, only AFSCME Local 88 Regular employees had statistically significantly higher limited duration assignment rates at 5.2% compared to the countywide rate of 4.0%. No other bargaining units had statistically significantly different limited duration rates compared to the countywide rate.
Work out of Class/Temporary Assignments
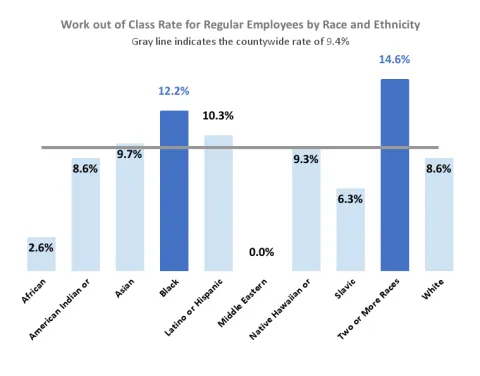
The countywide work out of class/temporary assignment rate for Regular employees was 9.4% between FY 2020 and FY 2022. To better understand the nuances of these results, we examined whether work out of class/temporary assignments trends varied among different demographic groups.
We found that for Regular employees, there were statistically significant results in work out of class/temporary assignment rates depending on:
- Race and ethnicity
- Gender binary
- Generation
- Bargaining unit
There were no results that were statistically significant regarding work out of class/temporary assignment rate based on other demographic categories for which we had data, including Disability, inclusive Gender Identity, Sexual Orientation, and veteran status. You may view work out of class/temporary assignment data for all demographic groups in the dashboards.
Race and ethnicity
Between FY 2020 and FY 2022, Black and African American Regular employees (12.2%) and Regular employees identifying as Two or More Races (14.6%) had a significantly higher work out of class/temporary assignment rates than the countywide rate (9.4%). Although other race and ethnicity groups may look different than the countywide rate, they did not reach statistical significance, likely due to there being fewer employees in those groups.
Gender Binary
For these analyses, we used data from the non-inclusive binary “Gender” field in Workday because at this time, it offers fewer missing values than the data from Workday’s more inclusive “Gender Identity” field. However, we recognize that although this data set has fewer missing values, it may not accurately represent the employee’s gender identities and should be interpreted with caution.
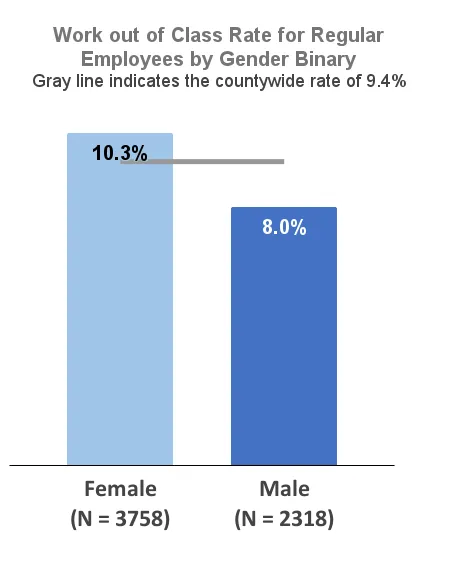
Between FY 2020 and FY 2022, Male Regular employees (8.0%) had a significantly lower work out of class/temporary assignment rate than the countywide rate (9.4%). Female Regular employees (10.3%) did not statistically significantly differ than the countywide rate.
Generation
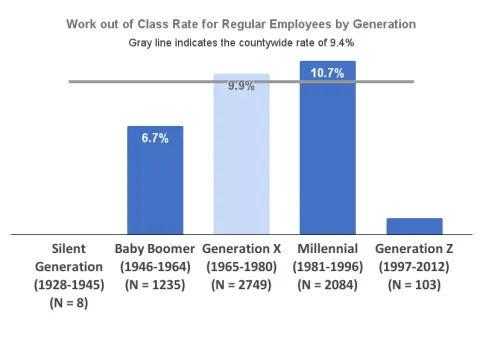
Between FY 2020 and FY 2022, the countywide rate for work out of class/temporary assignment was 9.4%. Both Baby Boomers (those born between 1946 and 1964) and Generation Z (those born between 1997 and 2012) Regular employees had statistically significantly lower rates at 6.7% and 1.0%, respectively. At 10.7%, Millennial Regular employees (those born between 1981 and 1996) had statistically significantly higher work out of class/temporary assignment rates than the countywide 9.4% rate. Generation X Regular employees (those born between 1965 and 1980) had a rate of 9.9%, which did not statistically significantly differ from the countywide rate.
Bargaining Unit
We evaluated work out of class rates by bargaining unit, several of which align with particular County departments and offices (e.g., the Deputy Sheriff’s Association bargaining unit is only in the Sheriff’s Office; Oregon Nurses Association-ONA employees are primarily in the Health department; Prosecuting Attorneys are only in the District Attorney’s Office).
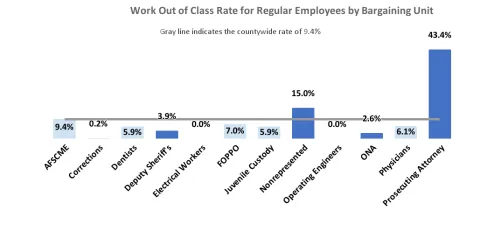
Between FY 2020 and FY 2022, Regular employees in the Deputy Sheriff’s Association (3.9%) and ONA (2.6%) had statistically significantly lower work out of class/temporary assignment rates than the countywide rate of 9.4%. The Deputy Sheriff’s bargaining unit very rarely uses work out of class assignments, instead opting to use special assignments, which have similar functions, but are not tracked the same way as work out of class assignments. The Health Department is unable to use work out of class assignments for Oregon Nurses Association positions because job profiles within ONA are defined by their licensure and scope of practice. Additionally, there is a limited number of management positions that require a registered nurse or nurse practitioner license, and other generic management positions have similar salary ranges as the Registered Nurse (RN) and Nurse Practitioner (NP) job profiles.
Non-represented and Prosecuting Attorneys Regular employees had statistically significantly higher work out of class/temporary assignment rates at 15.0% and 43.4%, respectively, than the countywide rate of 9.4%. The Prosecuting Attorneys bargaining unit uses work out of class designations as a method of allowing employees to gain experience and providing them opportunities for professional growth before moving toward promotions. Given that the separation rates for the District Attorney’s Office were significantly higher than the countywide rates in FY 2020 and FY 2022, there were many positions that became vacant. As the DA’s Office aims to promote employees from within the organization rather than make external hires, work out of class designations provide a popular pathway to fill vacant positions.
The other bargaining units did not statistically significantly differ from the countywide work out of class/temporary assignment rate.
Reclassifications
Reclassifications are when a manager or employee requests to change the job profile assigned to an existing position. It may occur when the primary focus of a position has evolved, minimum qualifications have changed, or major duties are added or removed. Reclassification does not always result in a pay grade change or an adjustment in an employees’ rate of pay.
The reclassification data in Workday only includes employees who have received a reclassification. These data do not include information about submitted applications for reclassification or whether they were approved, denied, or withdrawn; that information exists elsewhere and it is beyond the scope of this project to evaluate the reclassification process. All of these factors would be essential to truly understanding whether employees have equitable access to reclassifications. This analysis of reclassifications does not include Reclassification Studies (e.g., Market Studies). Reclassification studies also did not have any statistically significant differences based on demographic groups. Please see the dashboards for data showing reclassifications for various groups.
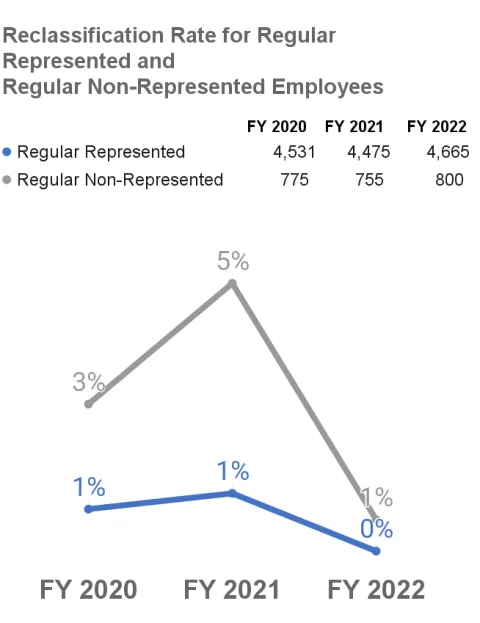
Regular Represented and Regular Non-Represented employee groups both saw increases in reclassification rates in FY 2021 from the previous fiscal year. The reclassification rate for Regular Represented employees was 3.0% in FY 2020, which increased to 5.3% in FY 2021 before decreasing to 0.8% in FY 2022. Both changes were statistically significant.
The reclassification rates for Regular Non-Represented employees were lower than the corresponding rates for Regular Represented employees between FY 2020 and FY 2022. The rates for Regular Non-Represented employees in both FY 2020 and FY 2021 were around 1.0% before it statistically significantly decreased to 0.2% in FY 2022.
There were no statistically significant differences in reclassification rates across demographic groups, including Race and Ethnicity, Disability, Gender, Generation, Sexual Orientation, or Veteran Status categories.
Demotions
Demotions can be voluntary and involuntary, but both are rare for Regular employees. The overall demotion rate — combining voluntary and involuntary demotions among all Regular employees — was 1.4% between FY 2020 and FY 2022 and did not statistically significantly change from fiscal year to fiscal year. There were 188 total demotions in that timeframe.
In addition, there were no statistically significant differences in voluntary, involuntary, or overall demotion rates across race and ethnicity, disability, gender, generation, or veteran status. Please see the dashboards for data showing demotions for various groups.
Sexual Orientation
Regular employees who identify as gay had a statistically significantly higher voluntary demotion rate at 5.4% than the countywide rate of 1.4%. However, it’s important to remember that information about employees’ sexual orientations is mostly unknown, as approximately two-thirds of employees do not have their sexual orientation information entered into Workday. Analyses of employment actions in relation to sexual orientation can only be performed where this information is known. Therefore, results from these analyses may not accurately reflect the trends for all employees based on their sexual orientation and should be interpreted with these limitations in mind. We hope to have more complete sexual orientation data in the future and we encourage employees to enter their demographic information into Workday.
Bargaining Unit
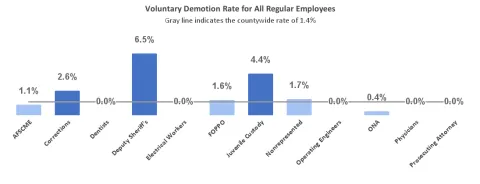
The Deputy Sheriff’s Association (6.5%), Corrections (2.6%), and Juvenile Custody Services Specialists (4.4%) bargaining units each had a significantly higher voluntary demotion rate between FY 2020 and FY 2022 than the countywide rate of 1.4%. For example, the Deputy Sheriff’s and Corrections Deputy Associations bargaining units allow for voluntary demotions for sworn members as a method for retaining employees within the Sheriff’s Office. In these cases, sworn members who want to try civilian roles move from a frontline first responder role to an administrative or support function that also traditionally results in a lower salary range. These positions may be considered as voluntary demotions, but are more aligned with the desired roles and career paths of employees.
Lead status
The lead status data in Workday only includes employees who have received a lead status. It does not look at other factors, such as time spent in lead status, length of service prior to receiving lead status, or the process to select employees for lead status. All of these factors would be essential to truly understanding whether employees have equitable access to lead status.
The lead status rate for Regular Represented employees was around 6% for each year between FY 2020 and FY 2022. The lead status rate did not significantly fluctuate across fiscal years during the reporting period, nor were there statistically significant differences in lead status rates across demographic categories, including Race and Ethnicity, Disability, Gender, Generation, Sexual Orientation, or Veteran Status. Please see the dashboards for data showing lead status for various groups.
Go to the next section: Movement of Other Employee Types