Black and African American Regular Employee Separation Rates

Black and African American Regular Employee Separation Rates

This page includes documents or other content that may not meet accessibility standards.

This page includes documents or other content that may not meet accessibility standards.

Documents marked “archived” may not work with assistive technologies. Request content in an accessible format.

Black and African American Regular Employee Separation Rates, Voluntary Separations (3.6% in FY 2020; 7.8% in FY 2021; 9.5% in FY 2022), Retirement (1.3% in FY 2020; 1.4% in FY 2021; 1.6% in FY 2022)
Black and African American Regular Employee Separation Rates

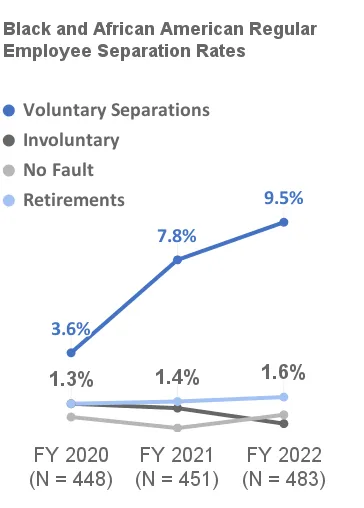
A line graph with fiscal year 2020 (N=448), 2021 (N=451), and 2022 (N=483) on the x-axis,  and separation rate by type for regular black and African American employees on the y-axis.

In fiscal year 2020, voluntary separations (3.6%), involuntary separations (1.3%), no fault separations (0.7%),  retirement (1.3%).

In fiscal year 2021, voluntary separations (7.8%), involuntary separations (1.1%), no fault separations (0.2%),  retirement (1.4%).

In fiscal year 2022, voluntary separations (9.5%), involuntary separations (0.4%), no fault separations (0.8%),  retirement (1.6%).

Last reviewed June 22, 2023