On this page
- Race and Ethnicity: Increased Promotion Rates for Several Groups
- Gender Binary: Increased Promotion Rates for Represented Employees across Gender and for Male Non-represented Employees
- Sexual Orientation: Increased Promotion Rates for Regular Represented Employees Identifying as Queer
- Promotions from Regular Represented and Non-represented Positions
For the purposes of this report, we focus on data of employees who were promoted. This report does not examine the promotion process, the length of service prior to receiving a promotion, the process to select employees for promotion, or the process of applying for promotions. All of these factors would be essential to truly understanding whether employees have equitable access to promotion.
We examined promotion rates for Regular Represented and Regular Non-represented employees between FY 2020 through FY 2022. For these analyses, we examined the positions that employees were promoted into. For example, if an employee was in a Regular Represented position, but was promoted into a Regular Non-represented position, they are considered a Regular Non-represented employee for the purposes of this analysis.
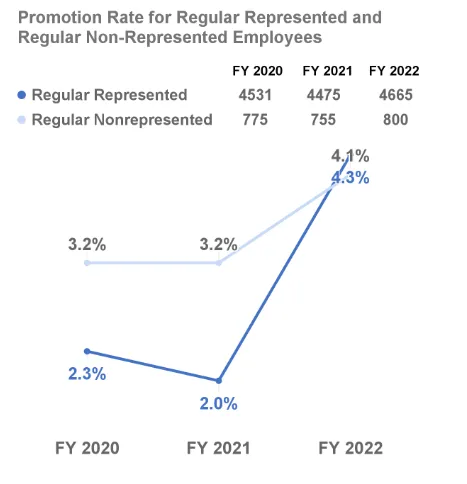
Regular Represented and Regular Non-represented employees both saw stable promotion rates between FY 2020 and FY 2021, but a statistically significant increase between FY 2021 and FY 2022.
More specifically, for Regular Represented employees, the promotion rates were around 2% in both FY 2020 and FY 2021, then statistically significantly increased to 4.3% in FY 2022. There was a similar, yet less-pronounced pattern for Regular Non-represented employees: the promotion rates were 3.2% in FY 2020 and FY 2021, then saw a statistically significant increase to 4.1% in FY 2022.
To better understand the nuances of these results, we examined whether different demographic groups showed different trends in promotion rates.
For Regular employees, there were statistically significant results based on:
- Race and Ethnicity
- Gender Binary
- Generation
- Sexual Orientation
There were no statistically significant hire rate results based on other demographic categories for which we had data, including Bargaining Unit, Disability, Inclusive Gender Identity, and Veteran Status. You may view information about promotions for all demographic groups in the dashboards. Department-specific results can be found in the departmental summaries and dashboards.
Race and Ethnicity: Increased Promotion Rates for Several Groups
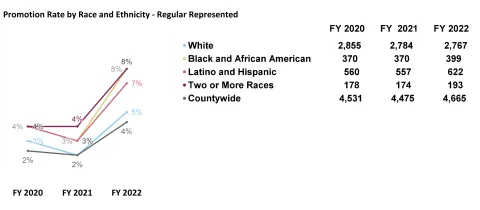
Regular Represented and Regular Non-represented employees who identified as White, Black, Hispanic of Two or More Races saw statistically significant changes in their promotion rates between FY 2020 and FY 2022.
Regular Represented groups of employees identifying as Black and African American, Hispanic and Latino, White, or Two or More Races had similar promotion rates in FY 2020 and FY 2021: between 2% and 4%. In FY 2022, each of these groups showed statistically significant increases in their respective promotion rates. Regular Represented employees identifying as Black and African American or Two or More Races saw their promotion rate jump to 8%; Hispanic or Latino employees had their promotion increase to 7%; and White employees had their promotion rate rise to 5%.
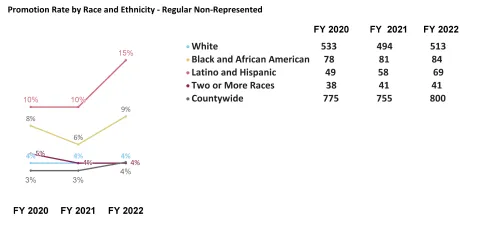
The changes in the promotion rate among race and ethnicity categories was more dramatic for Regular Non-represented employees. Black and African American Regular Non-represented employees had a promotion rate of 8% in FY 2020 that fell to 6% in FY 2021, then statistically significantly increased to 9% in FY 2022. Hispanic or Latino Regular Non-represented employees had the largest increase in promotion rate, from 10% in both FY 2020 and FY 2021, to 15% in FY 2022, a statistically significant increase.
White Regular Non-represented employees and Regular Non-represented employees identifying as Two or More Races had stable promotion rates between FY 2020 and FY 2022.
Gender Binary: Increased Promotion Rates for Represented Employees across Gender and for Male Non-represented Employees
For these analyses of promotion rates by gender, we used data from the non-inclusive binary “Gender” field in Workday because at this time, it offers fewer missing values than the data from Workday’s more inclusive “Gender Identity” field. However, we recognize that although this data set has fewer missing values, it may not accurately represent the employee’s gender identities and should be interpreted with caution.
There were no statistically significant results for analyses performed using data from the more inclusive Gender Identity field, mostly likely because there is a high rate of missing values; however, this information is provided in the dashboards. We are hopeful that future Gender Identity analyses will be possible as employees become more aware of and feel more comfortable providing this information in Workday.
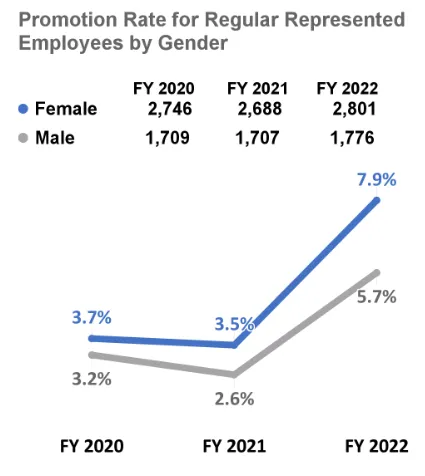
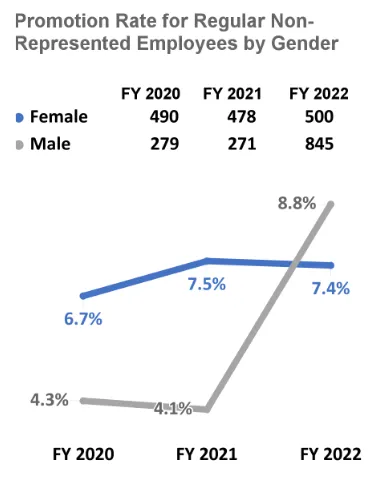
The promotion rate was steady for both female and male Regular Represented employees between FY 2020 and FY 2021, but higher overall for the Female group (3.7% in FY 2020 and 3.5% in FY 2021) than the Male group (3.2% in FY 2020 and 2.6% in FY 2021). However, both Gender groups of Regular Represented employees had statistically significantly higher promotion rates in FY 2022: 7.9% for the Regular Represented female employees and 5.7% for Regular Represented male employees.
The promotion rate for Regular Non-represented female employees remained steady between FY 2020 and FY 2022, hovering around 7%. For Regular Non-represented male employees, the promotion rate held stable between FY 2020 and FY 2021 at just above 4%, then statistically significantly increased to 8.8% in FY 2022, surpassing the promotion rate for the group of female Regular Non-represented employees.
Sexual Orientation: Increased Promotion Rates for Regular Represented Employees Identifying as Queer
Employees’ sexual orientation is mostly unknown, as approximately two-thirds of employees do not have their sexual orientation entered into Workday. Analyses of employment actions in relation to sexual orientation can only be performed where this information is known. Therefore, results from these analyses may not accurately reflect the trends for all employees’ based on their sexual orientation and should be interpreted with these limitations in mind. We hope to have more complete sexual orientation data in the future and we encourage employees to enter their demographic information into Workday.
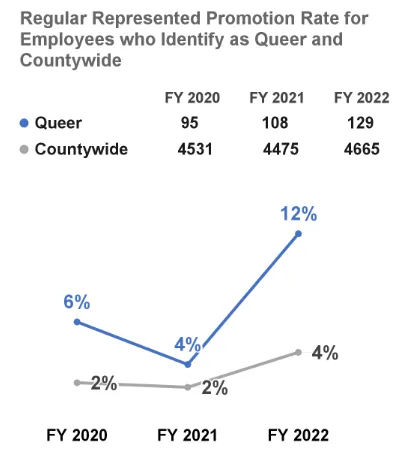
The promotion rate for Regular Represented employees who identified as Queer was 6.0% in FY 2020, slightly decreased to 4% in FY 2021, then statistically significantly increased to 12.0% in FY 2022. There were no statistically significant promotion rate results related to sexual orientation. As with previous results of demographics with substantial unknown data, these results should be interpreted with caution–nonetheless, they are still important and meaningful while being indicative of the need for more qualitative and quantitative data to better understand them.
Promotions from Regular Represented and Non-represented Positions
We examined both the types of positions that employees were promoted from and the types of positions employees were promoted into. Specifically, employees that received promotions were compared on whether they were Regular Represented or Regular Non-represented before their promotion, and whether they were promoted into Regular Represented or Regular Non-represented roles. We examined the three main types of promotional movements: Non-represented to Non-represented, Represented to Represented, and Represented to Non-represented. A fourth promotional movement, Non-represented to Represented, is possible, but exceptionally rare.
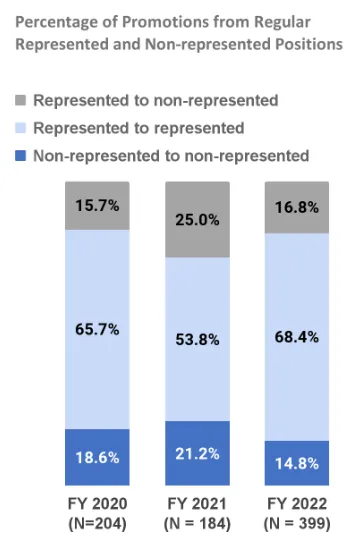
In the majority of promotions, employees remained within the same employee type — Regular Non-represented employees were most commonly promoted into Regular Non-represented positions, and Regular Represented employees were most commonly promoted into Regular Represented positions.
We were primarily interested in movement from Regular Represented to Regular Non-represented positions because this often signifies a promotion from frontline positions to supervisor or management positions. In FY 2020, 15.6% of all promotions were for Regular Represented employees being promoted into Regular Non-represented positions, which increased to 25.0% in FY 2021, before decreasing to 16.8% in FY 2022. Both the initial rise and subsequent drop were statistically significant.
We also examined the demographics of Regular Represented employees who received promotions in relation to whether they were promoted into Regular Represented or Regular Non-represented positions. Since some demographic groups had a low number of promotions over the course of a single fiscal year, we combined in each group the number of promotions across the entire reporting period.
There was a grand countywide total of 651 promotions of Regular Represented employees between FY 2020 and FY 2022. Of these promotions, 506 (77.7%) involved promotions into Regular Represented positions and 145 (22.3%) involved promotions into Regular Non-represented positions.
There were no statistically significant differences across race and ethnicity groups in the percentage of Regular Represented employees being promoted into Regular Non-represented positions. Most race and ethnicity groups had promotion rates from Regular Represented into Regular Non-Represented positions similar to the countywide rate of 23.3% (only showing percents for groups with more than 10 promotions per group):
- Asian (n = 48 promotions): 20.8% were Regular Represented to Regular Non-represented, 79.2% were Regular Represented to Regular Represented promotions.
- Black or African American (n = 71 promotions): 21.1% were Regular Represented to Regular Non-represented, 78.9% were Regular Represented to Regular Represented promotions.
- Latino or Hispanic (n = 115 promotions): 27.0% were Regular Represented to Regular Non-represented, 73.0% were Regular Represented to Regular Represented promotions.
- Two or More races (n = 38 promotions): 28.9% were Regular Represented to Regular Non-represented, 71.1% were Regular Represented to Regular Represented promotions.
- White (n = 351 promotions): 21.7% were Regular Represented to Regular Non-represented, 78.3% were Regular Represented to Regular Represented promotions.
There were also no significant differences across Gender groups in the percentage of Regular Represented employees being promoted into Regular Non-represented positions. There were no statistically significant differences between Regular Represented Female employees who were promoted into a Regular Non-represented position (22.7%) and Regular Represented Male employees who were promoted into a Regular Non-represented position (21.4%).
An important consideration to keep in mind about our analyses for differences in the rates of particular promotion movements across the Gender category is that we used data from the non-inclusive binary “Gender” field in Workday because, at this time, it offers fewer missing values than the data from Workday’s more inclusive “Gender Identity” field. However, we recognize that although the “Gender” data set has fewer missing values, it still may not represent the full (and therefore a more accurate) picture of the identities that exist within our workforce, and should be interpreted with caution.
There were no significant differences across generations in the percentage of Regular Represented employees being promoted into Regular Non-Represented positions. The percentage of promotions from Regular Represented Baby Boomers into Regular Non-Represented positions was 15.8%, 27.0% for Generation X was 27%, and 19.8% for Millennials.
We were unable to examine trends for Disability, inclusive Gender Identity, Sexual Orientation or Veteran Status categories because of the small numbers of promotions and/or the extent of incomplete information for those demographics.
Go to the next section: Other Employee Movements for Regular Employees