
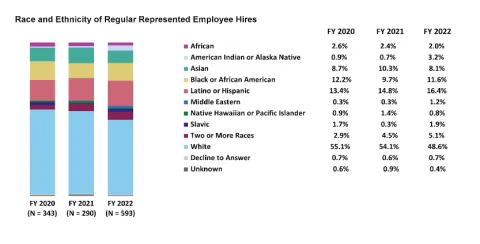
A stacked bar chart with fiscal year 2020 (N = 343), 2021 (N = 290), and 2022 (N = 593) on the x-axis, and race and ethnicity of regular represented hires on the y-axis.
In fiscal year 2020: African (2.6%), American Indian or Alaska Native (0.9%), Asian (8.7%), Black or African American (12.2%), Latino or Hispanic (13.4%), Middle Eastern (0.3%), Native Hawaiian or Pacific Islander (0.9%), Slavic (1.7%), Two or More Races (2.9%), White (55.1%), Decline to Answer (0.7%) and Unknown (0.6%).
In fiscal year 2021: African (2.4%), American Indian or Alaska Native (0.7%), Asian (10.3%), Black or African American (9.7%), Latino or Hispanic (14.8%), Middle Eastern (0.3%), Native Hawaiian or Pacific Islander (1.4%), Slavic (0.3%), Two or More Races (4.5%), White (54.1%), Decline to Answer (0.6%) and Unknown (0.9%).
In fiscal year 2022: African (2%), American Indian or Alaska Native (3.2%), Asian (8.1%), Black or African American (11.6%), Latino or Hispanic (16.4%), Middle Eastern (1.2%), Native Hawaiian or Pacific Islander (0.8%), Slavic (1.9%), Two or More Races (5.1%), White (48.6%), Decline to Answer (0.7%) and Unknown (0.4%).