On this page
- Employee Level: Non-supervising Frontline Staff had a Higher Voluntary Separation Rate in FY 2022
- Race and Ethnicity: Voluntary Separation Rate Increased for Black and African American Regular Employees
- Race and Ethnicity: Voluntary Separation Rate Increased for Regular Represented Employees of Two or More Races
- Race and Ethnicity: Voluntary Separation Rate Increased for White Regular Employees
- Gender Binary: Different Patterns of Separation Rates for Female and Male Regular Employees
- Generation: Voluntary Separations Increased for All Regular Generation X and Millennial Employees
- Disability Status: Voluntary Separations Increased for Regular Represented Employees with Disabilities
- Sexual Orientation: Voluntary Separation Rate Increased for Regular Represented Employees identifying as Gay, Bisexual, and Heterosexual
- Bargaining Units: Different Patterns of Separation Rates
- Separations within the First Year of Hire
employee retires from the workforce; voluntary separations are employees choosing to leave the County. We examined the overall separation rate, as well as the rate for each separation type.
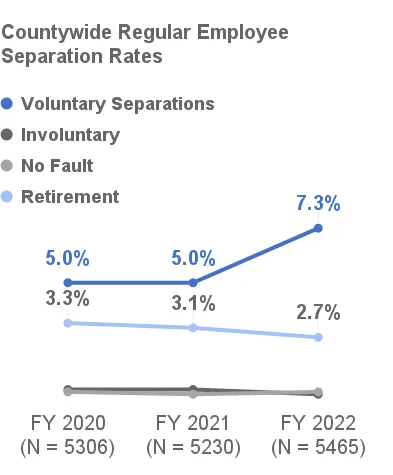
Countywide for all Regular employees, the most common separation type was voluntary separations. The voluntary separation rates in FY 2020 and FY 2021 were 5%. In FY 2022, the voluntary separation rate increased to 7.3%, a statistically significant change.
Involuntary separations and no fault separations happened infrequently, both occurring at a stable rate of less than 1% throughout the entire reporting period.
The retirement rate remained close to 3% each fiscal year. Like the rates for no fault separations and involuntary separations, the retirement rate stayed stable between FY 2020 and FY 2022.
To better understand the nuances of these results, we examined whether separation trends varied among different demographic groups.
We found that for Regular employees, there were statistically significant results in separation rates depending on:
- Employee level
- Race and ethnicity
- Gender binary
- Disability
- Generation
- Sexual orientation
- Bargaining unit
Countywide, there were no statistically significant separation rate results based on other demographic categories for which we had data, including veteran status. You may view those separation rates in the separation dashboards. Department-specific results can be found in the departmental summaries and dashboards.
Employee Level: Non-supervising Frontline Staff had a Higher Voluntary Separation Rate in FY 2022
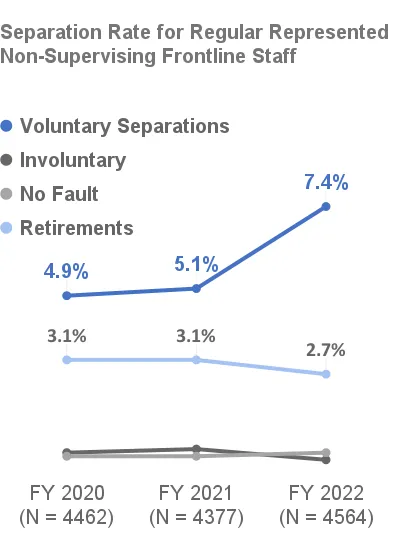
When we examined separation rates further, we found that the countywide results for Regular employees were primarily driven by results for Non-supervising Frontline staff, who make up the majority of Regular Represented employees. The most common separation type among Regular Represented Non-supervising Frontline staff was voluntary separations. In FY 2020 and FY 2021, the voluntary separation rate specifically for this group was around 5%. In FY 2022, the voluntary separation rate statistically significantly increased to 7.4%, slightly higher than the countywide average for all types of employees combined.
Among Regular Represented Non-supervising Frontline staff, involuntary separations and no fault separations occurred infrequently and were stable, with less than 1% separation rate in each year between FY 2020 and FY 2022.
The retirement rate was stable at around 3% each fiscal year for Regular Represented Non-supervising Frontline staff between FY 2020 and FY 2022.
There were no statistically significant separation rate results for other employee levels or non-represented employees (the majority of Regular Non-represented employees are supervisor or management level). See the separation dashboards for separation rates for these groups.
Race and Ethnicity: Voluntary Separation Rate Increased for Black and African American Regular Employees
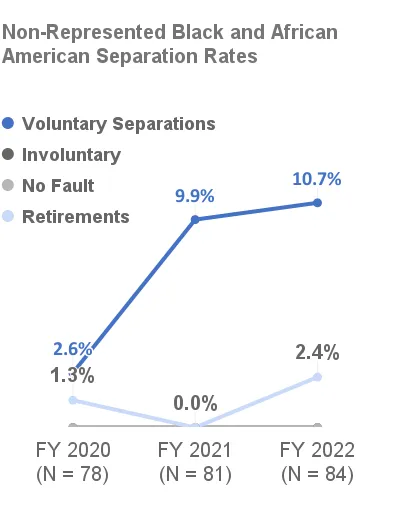
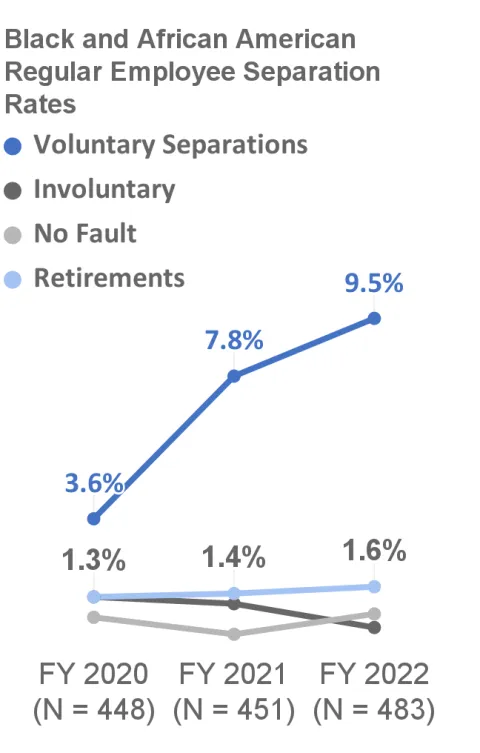
The majority of separations for Regular employees who identify as Black and African American are voluntary separations. The voluntary separation rate for this group has steadily increased, from 3.6% in FY 2020 to 7.8% in FY 2021, to 9.5% in FY 2022.
In contrast to voluntary separations, involuntary separations, no fault separations, and retirements were relatively infrequent with a rate of less than 1.5% and remained relatively stable across FY 2020, FY 2021, and FY 2022 for each of these separation types. Any changes in the rates of involuntary separations, no fault separations, and retirements were not statistically significant.
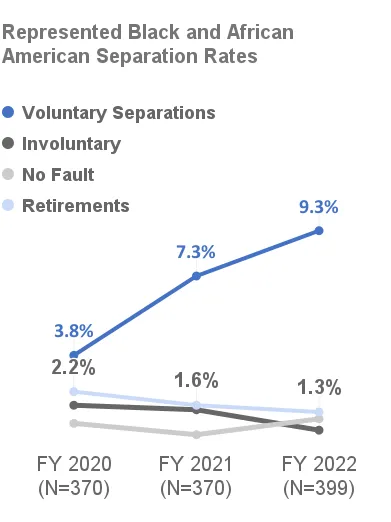
To examine these results further, we looked at results for Black and African American Represented employees and Non-represented employees separately. The results were fairly similar between the two groups — both showed statistically significant increases in voluntary separation rates between FY 2020 and FY 2022. However, for Regular Non-represented Black and African American employees, there was a sharper increase in voluntary separation rates between FY 2020 and FY 2021 than between FY 2021 and FY 2022.
Retirements, involuntary separations, and no fault separations for both Regular Represented and Non-represented Black and African American employee groups were relatively infrequent at a rate of less than 2%, which held stable between FY 2020 and FY 2022. Any changes in the rates of involuntary separations, no fault separations, and retirements were not statistically significant.
Race and Ethnicity: Voluntary Separation Rate Increased for Regular Represented Employees of Two or More Races
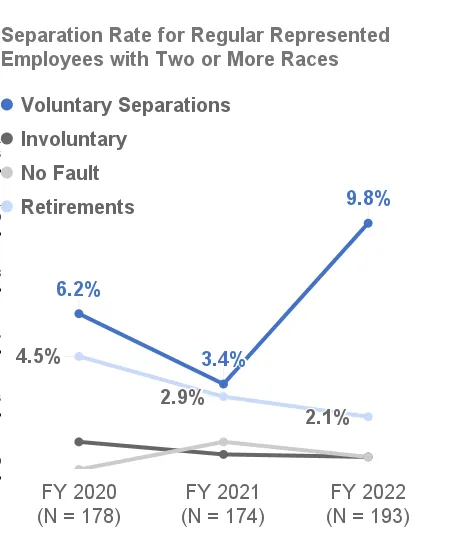
Voluntary separations were also the most common separation type for Regular Represented employees identifying as Two or More Races. The voluntary separation rate for this group of employees was 6.2% in FY 2020 and dropped to 3.4% in FY 2021. However, the voluntary separation rate for this group significantly increased to 9.8% in FY 2022. There was also a downward trend in retirements for Regular Represented employees of Two or More Races. Any changes in the rates of these involuntary separations, no fault separations and retirements were not statistically significant.
There were no statistically significant changes for separation rates for Regular Non-represented employees who identified as being Two or More Races.
The trends among Black and African American and employees and employees of Two or More Races are concerning. Further research using both quantitative and qualitative methods will be necessary to better understand why Black and African American and employees of Two or More Races chose to leave the county at higher rates during this time period.
Although the diversity of employees increased in relation to both Regular Represented hires and the overall Regular County workforce, the rise in voluntary separations rates for Regular Black and African American employees and employees of Two or More Races indicates that efforts to retain Black and African American employees and employees of Two or More Races will be increasingly important to maintaining and growing racial and ethnic diversity at the County.
Race and Ethnicity: Voluntary Separation Rate Increased for White Regular Employees
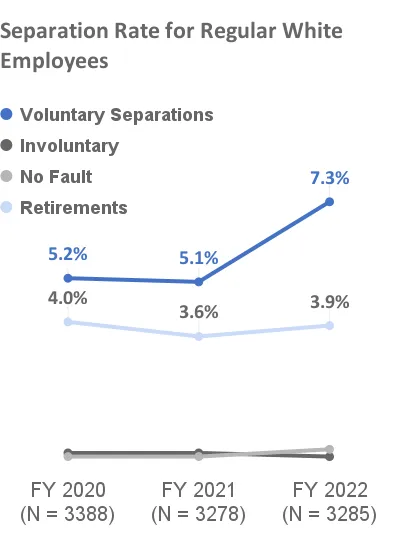
Mirroring what we see at the countywide level, the voluntary separation rate for White Regular employees was similar between FY 2020 and FY 2021 at around 5%, but had a statistically significant increase in FY 2022 to 7.3%. White Regular employees had relatively infrequent involuntary and no fault separations across all three fiscal years. However, the retirement rate for White Regular employees was higher than the retirement rate for Black and African American Regular employees throughout the reporting period. The retirement rate remained stable for White Regular employees between FY 2020 and FY 2022, with a rate around 4%.
There were no statistically significant separation rate results for other race and ethnicity groups, although some race and ethnicity groups may not reach statistical significance because they are relatively small groups. See the separation dashboards for separation rates for all groups.
Gender Binary: Different Patterns of Separation Rates for Female and Male Regular Employees
For these analyses of separation rates by gender, we used data from the non-inclusive binary “Gender” field in Workday because at this time, it offers fewer missing values than the data from Workday’s more inclusive “Gender Identity” field. However, we recognize that although this data set has fewer missing values, it may not accurately represent the employee’s gender identities and should be interpreted with caution.
There were no statistically significant results for the more inclusive Gender Identity field, most likely because there is a high rate of missing values; however, this information can still be viewed in the dashboards. We are hopeful that future Gender Identity analyses will be possible as employees become more aware of and feel more comfortable providing this information in Workday.
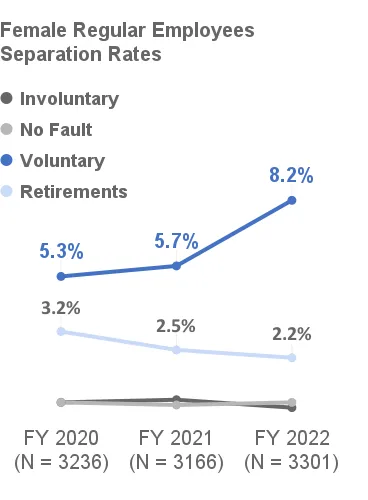
When looking at all Regular employees who identified as being Female, the voluntary separation rate was 5.3% in FY 2020 and 5.7% in FY 2021, but increased to 8.2% in FY 2022, a statistically significant change. Retirements among this group had a statistically significant downward trend between FY 2020 and FY 2022, moving from 3.2% in FY 2020 down to 2.5% in FY 2021, and then 2.2% in FY 2022. Involuntary and no fault separations were relatively uncommon, with the rate remaining below 1% between FY 2020 and FY 2022.
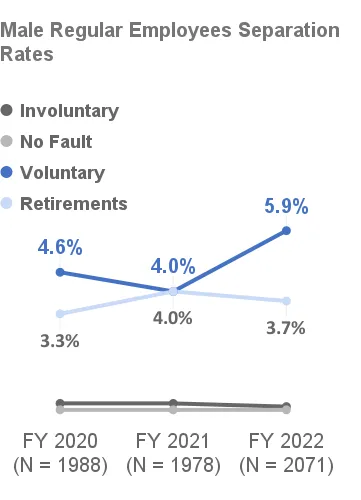
Regular employees who identified as being Male had a voluntary separation rate of 4.6% in FY 2020 and a similar rate of 4.0% in FY 2021, but the voluntary separation rate increased to 5.9% in FY 2022, a statistically significant rise. The retirement rate for Regular Male employees was between 3% and 5% from FY 2020 to FY 2022. Involuntary and no fault separation rates for Male Regular employees between FY 2020 and FY 2022 were below 1% throughout the reporting period.
Separation rates for all of the inclusive gender identities are viewable in the dashboards.
Generation: Voluntary Separations Increased for All Regular Generation X and Millennial Employees
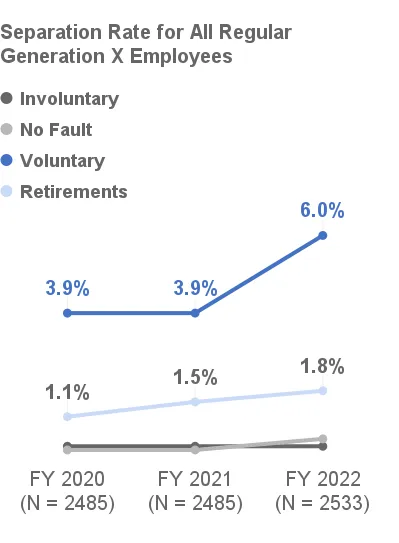
We examined separation rates across generations of employees and found that there was a statistically significant increase for voluntary separations for Regular Generation X employees, from 3.9% in FY 2020 and FY 2021, to 6.0% in FY 2022. There were no other significant trends in other separation types for Regular Generation X employees.
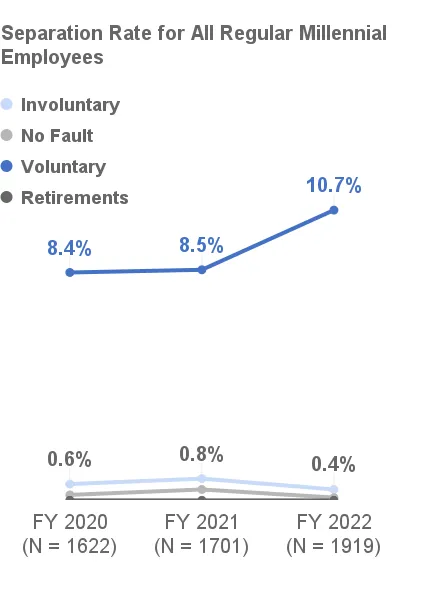
Similarly, the voluntary separation rate for Regular Millennial employees statistically significantly increased from 8.4% in FY 2020 and 8.5% in FY 2021, to 10.7% in FY 2022. Involuntary separations, no fault separations, and retirements were relatively infrequent and had no statistically significant trends between FY 2020 and FY 2022 for this group.
Separation rates for all generation groups are viewable in the dashboards.
Disability Status: Voluntary Separations Increased for Regular Represented Employees with Disabilities
While we examined separation rates for employees with disabilities, it is also important to note that there is a large amount of unknown data regarding employees’ disability statuses. Currently, almost 50% of employees do not have their disability status entered into Workday, leaving their status unknown. This means that when we examine trends for employees with disabilities, the analyses can only be done for employees for whom disability status is known and may not accurately reflect all employees with disabilities. Therefore, these results should be interpreted with these limitations in mind.
This is not to say that these results are not important or meaningful — just that we need more data, both qualitative and quantitative, to better understand these trends. We hope to have more complete disability status data in the future and we encourage employees to enter their demographic information into Workday.
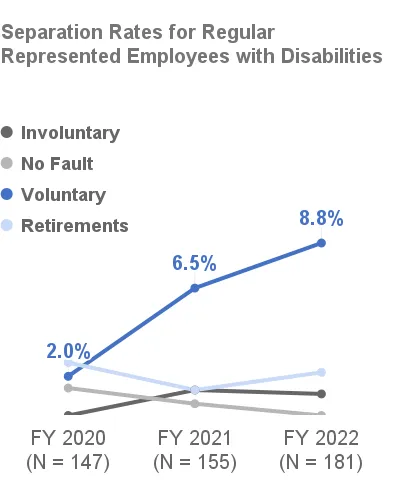
The voluntary separation rate for Regular Represented employees with disabilities was 2.0% in FY 2020, which statistically significantly increased to 6.5% in FY 2021. The rate increased again (yet, not statistically significantly) to 8.8% in FY 2022. Changes in the rates of involuntary separations, no fault separations, and retirements were not statistically significant. In addition, there were no statistically significant trends for Regular Non-represented employees with disabilities.
Sexual Orientation: Voluntary Separation Rate Increased for Regular Represented Employees identifying as Gay, Bisexual, and Heterosexual
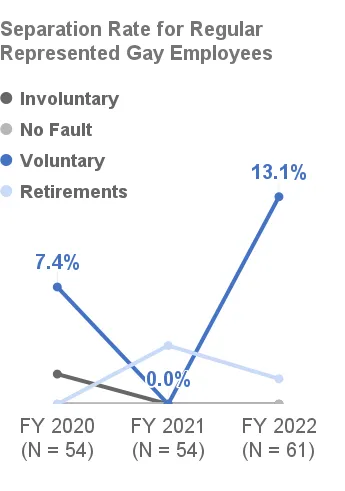
The voluntary separation rate for Regular Represented employees who identified as Gay was 7.4% in FY 2020, and dropped all the way down to 0% in FY 2021. The rate then statistically significantly increased to 13.1% in FY 2022. Changes in the rates of involuntary separations, no fault separations and retirements were not statistically significant. Additionally, there were no statistically significant trends in separations for Regular Non-represented employees who identify as Gay.
It is important to note that the total number of Regular Represented employees identifying as Gay from FY 2020 to FY 2022 was relatively small: between 54 and 61. A smaller group means that very few separations can dramatically impact separation rates. This, coupled with the large proportion of employees for whom we don’t know sexual orientation means we should interpret the results with caution. As with disability status, results that require a more cautious approach are still important and meaningful while being indicative of the need for more qualitative and quantitative data.
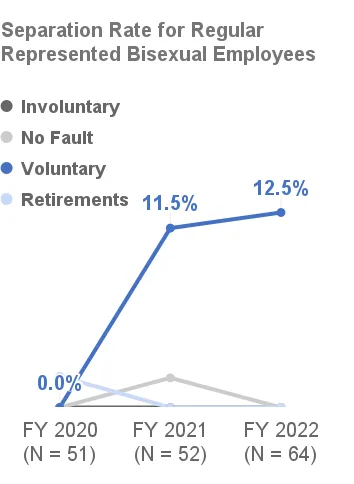
Among Regular Represented employees identifying as Bisexual, there were no voluntary separations in FY 2020, there were no voluntary separations. However, there was a statistically significant increase in the voluntary separation rate in FY 2021 to 11.5%, which then remained relatively steady in FY 2022 at 12.5%. No other separation types had statistically significant trends between FY 2020 and FY 2022 for this group. An analysis of changes in the separation rate for Regular Non-represented employees who identified as Bisexual did not produce any statistically significant results.
The caveats about small group numbers similarly apply to Regular Represented employees identifying as Bisexual — the total numbers of people in this group ranged from 51 to 64 between FY 2020 to FY 2022.
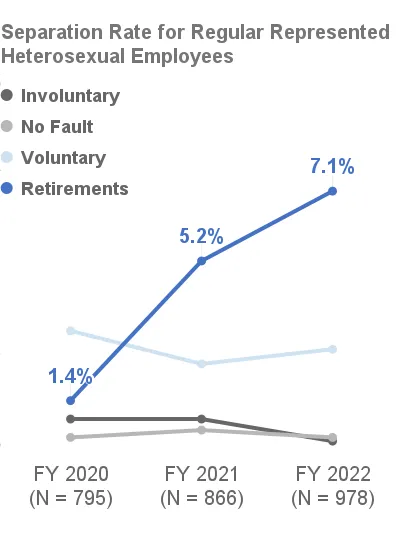
The voluntary separation rate for Regular Represented employees identifying as Heterosexual steadily and statistically significantly increased from 1.4% in FY 2020 to 5.2% in FY 2021 and 7.1% in FY 2022. There were no other significant trends for other separation types and there were no significant trends in any separation type for Regular Non-represented Heterosexual employees.
Separation rates for all sexual orientations are viewable in the dashboards.
Bargaining Units: Different Patterns of Separation Rates
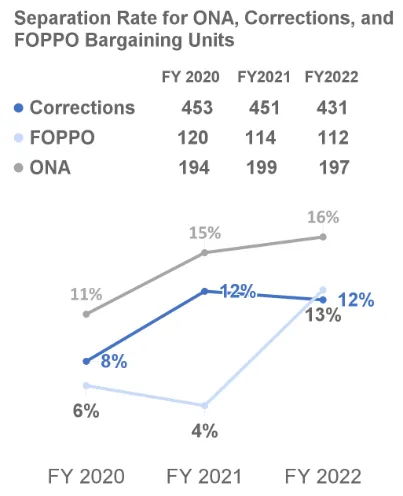
The Oregon Nurses Association, Corrections Deputy Association, and the Federation of Oregon Parole and Probation Officers each saw an increase in the overall separation rate between FY 2020 and FY 2022. Notably, these bargaining units represent employees involved with public health and public safety, which were areas of work that were greatly impacted by the COVID-19 pandemic and social justice movements during the reporting period.
Two bargaining units saw statistically significant increases in their separation rates during the first two fiscal years of the reporting period, followed by a year without significant change. ONA had a separation rate that rose from 11% in FY 2020 to 15% in FY 2021, which then remained relatively steady in FY 2022 at 16%. The Corrections Deputy Association had separation rates that went from 8% in FY 2020 to 12% in FY 2021, then remained at 12% in FY 2022.
FOPPO’s separation rate held steady at 6% in FY 2020 and 4% in FY 2021, but saw a statistically significant increase to 13% in FY 2022. (This graph and percentages for FOPPO in FY 2020 and FY 2021 were updated on 4/28/23 with the correct rates, which were previously misprinted; we also added the number of employees in each group to the table at the top of the graph.)
Separations within the First Year of Hire
In the “HR Trends” Report from FY 2015 and FY 2016, we found that Black and African American employees experienced trial service separations (previously known as probationary terminations) at a higher rate (10%) than White employees (4%). Therefore, we were particularly focused on whether these trends remained between FY 2020 and FY 2022.
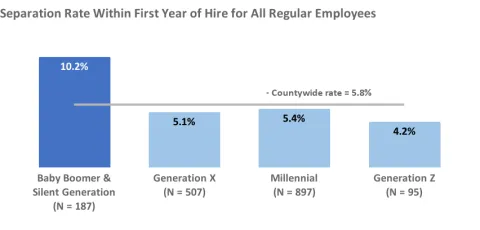
Because there were very few separations within the first year of hire for Regular employees in each fiscal year, we chose to combine data for all three fiscal years in our analyses. (This is consistent with the analyses from the previous report, which combined separations from FY 2015 and FY 2016. This report, however, includes an additional full fiscal year.) Of the 1,690 Regular employees who were in their first year of hire between FY 2020 and FY 2022, 98 of them (5.8%) experienced an involuntary, voluntary, or no fault separation within that first year.
We found no statistically significant differences in separation rate within the first year for any of the race and ethnicity groups, including Black and African American employees. Employees’ Generation was the only other demographic category for which we found any statistically significant differences: Baby Boomers and older employees showed meaningful proportional differences in separations during their first year of hire across the reporting period. When combined, the Baby Boomers and employees from the Silent Generation had a separation rate of 10.2% in the first year of hire, a statistically significantly higher rate than the countywide rate (5.8%).
Go to the next section: Hires