Former reports in this area were called “HR Trends.” We have updated the name to better reflect what is included in analyses.
Separations and Hires Increased in FY 2022
Over the past three fiscal years, the County experienced a period of change among all Regular employees ( both Represented and Non-represented Regular employees). Although the rate of separations among Regular employees climbed in FY 2022, there was also a corresponding rise in the rate of hiring rates among Regular employees for the same period.
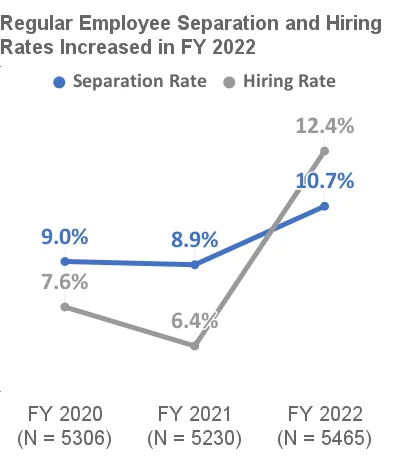
Overall separation rates for all Regular employees in FY 2020 and FY 2021 were similar: 9% and 8.9%, respectively. In FY 2022, the separation rate rose to 10.7%, a statistically significant increase.
Hiring rates over the reporting time frame followed a similar pattern as separations. In FY 2020, the hiring rate for Regular employees was under 8%. After a decrease in the FY 2021 hiring rate saw it drop below 7%, the hiring rate increased the next fiscal year to over 12% in FY 2022, which was a statistically significant change.
Overall Countywide Workforce is More Racially and Ethnically Diverse and Younger
The demographics of all Regular employees have shifted over the past three years. Specifically, the countywide workforce has become more racially and ethnically diverse and younger as a result of the turnover and separations, and increased hiring activities.
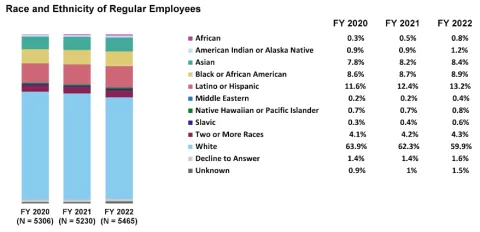
With regard to race and ethnicity, White employees continue to make up the majority of all Regular employees. However, the share of all Regular employees that identify as White has steadily decreased over the reporting period. In FY 2020, 64% of all Regular employees identified as White. But by FY 2022, 60% of all Regular employees identified as White, while the share of all Regular employees identifying as Black, Indigenous or other people of color (i.e., BIPOC) had a corresponding increase to 40% during that time. This change reflected an increase of BIPOC employees as a combined group; we did not find substantial increases among specific BIPOC groups.
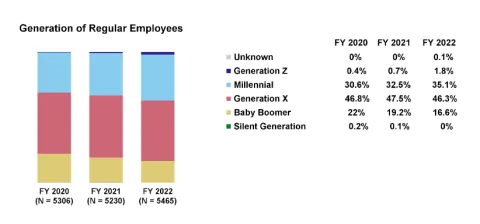

Regarding age and generation, the percentage of all Regular employees belonging to Generation X or Millennials remained relatively steady from FY 2020 to FY 2022. However, the share of Baby Boomers in the County workforce significantly decreased from 22% in FY 2020 to 16.6% in FY 2020. Meanwhile, the share of all Regular employees in Generation Z increased from less than 1% in FY 2020 to almost 2% in FY 2022.
Generation (Pew Research Center definitions) & Year born
- The Silent Generation: 1928 - 1945
- Baby Boomer: 1946 - 1964
- Generation X: 1965 - 1980
- Millennial: 1981 - 1996
- Generation Z: 1997 - 2012
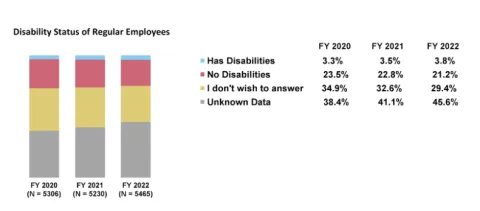
Regarding disability, it is important to note that there is a large amount of unknown data regarding employees’ disability statuses. Currently, almost 50% of employees do not have their disability status entered into Workday, leaving their status unknown. This means that when we examine trends for employees with disabilities, the analyses can only be done for employees for whom disability status is known (between 3% - 4% of employees identified having disabilities) and may not accurately reflect all employees with disabilities. Therefore, results related to disability should be interpreted with these limitations in mind.
This is not to say that results in the report related to disability are not important or meaningful — just that we need more data, both qualitative and quantitative, to better understand these trends. We are hopeful that future disability analyses will be possible as employees become more aware of and feel more comfortable providing this information in Workday.
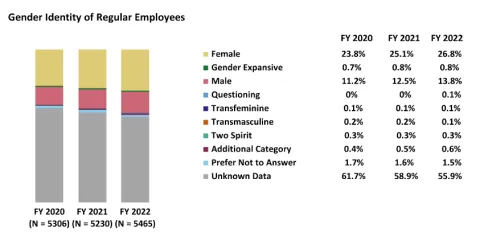
Similar to disability status, there is a substantial amount of unknown data about employees’ gender identity using the inclusive data field in Workday. Currently, over 55% of employees do not have their gender identity entered into Workday, leaving their status unknown.
In Workday, there is also a non-inclusive binary “Gender” field that offers fewer missing values than the data from Workday’s more inclusive “Gender Identity” field. In many analyses, we report results using the non-inclusive binary “gender” data. However, we recognize that although this data set has fewer missing values, it may not accurately represent the employee’s gender identities and should be interpreted with caution.
We are hopeful that future gender identity analyses will be possible as employees become more aware of and feel more comfortable providing this information in Workday.
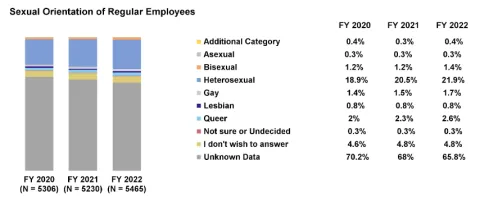
Similar to disability status and gender identity, there is a substantial amount of unknown data about employees’ sexual orientation available in Workday. Currently, over 65% of employees do not have their sexual orientation entered into Workday, leaving their status unknown. We examined trends related to sexual orientation, but results related to sexual orientation should be interpreted with these limitations in mind. We are hopeful that future sexual orientation analyses will be possible as employees become more aware of and feel more comfortable providing this information in Workday.
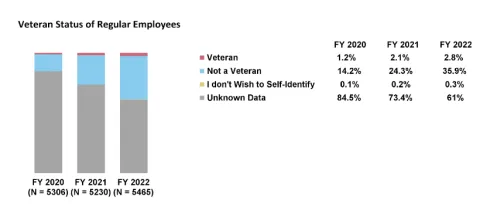
Similar to disability status, gender identity, and sexual orientation, there is a substantial amount of unknown data about employees’ veteran status available in Workday. Currently, over 60% of employees do not have their veteran status entered into Workday, leaving their status unknown. We examined trends related to veteran status, but results related to veteran status should be interpreted with these limitations in mind. We are hopeful that future veteran status analyses will be possible as employees become more aware of and feel more comfortable providing this information in Workday. (The graph and percentages for the Veteran Status of Regular employees was updated on 4/28/23 with the correct percentages, which were previously mis-printed.)
Go to the next section: Separations